Statewide annual average temperatures warmed by 2.3°F from 1980 to 2022.
Only one year in the 21st century has been cooler than the 1971-2000 average. 2012 remains the state’s warmest year in the 128-year record, at 48.3°F (3.2°F warmer than the
1971-2000 average).
The greatest amount of warming has occurred in the fall, with statewide temperatures
increasing by 3.1°F from 1980-2022.
Southwestern and South-central Colorado have experienced the largest magnitude of
warming.
The observed warming trend in Colorado is strongly linked to the overall human influence
on climate and recent global warming. The observed warming over the last 20 years is
comparable to what was projected by earlier climate models run in the 2000s.
Further and significant warming is expected in all parts of Colorado, in all seasons, over
the next several decades.
By 2050 (the 2035-2064 period average), Colorado statewide annual temperatures are
projected to warm by +2.5°F to +5.5°F compared to a 1971-2000 baseline, and +1.0°F to
+4.0°F compared to today, under a medium-low emissions scenario (RCP4.5).
By 2070 (the 2055-2084 period average), Colorado statewide annual temperatures are projected to warm by +3.0°F to +6.5°F compared to the late 20th century, and +1.5°F to
+5.0°F compared to today, under RCP4.5.
By 2050, the average year is likely to be as warm as the very warmest years on record
through 2022. By 2070, the average year is likely to be warmer than the very warmest years
through 2022.
Summer and fall are projected to warm slightly more than winter and spring.
Precipitation
Colorado has observed persistent dry conditions in the 21st century. According to
water year precipitation accumulations, October 1 – September 30, four of the five driest
years in the 128-year record have occurred since 2000.
Drying trends have been observed across the majority of the state during the spring,
summer, and fall seasons.
Northwest Colorado summer precipitation has decreased 20% since the 1951-2000 period.
Southwest Colorado spring precipitation has decreased 22% since the 1951-2000 period.
Precipitation is slightly more favorable over the northern mountains during a La Niña
winter. For most regions and the remaining seasons, wetter conditions are slightly
enhanced during an El Niño.
The direction of future change in annual statewide precipitation for Colorado is much less
clear than for temperature. The climate model projections for 2050 range from -7% to +7%
compared to the late 20th century average, under a medium-low (RCP4.5) emissions scenario.
The model projections for precipitation change by 2070 are very similar to those for 2050.
Most climate models project an increase in winter (Dec-Feb) statewide precipitation;
the model consensus is weaker for the other seasons. The models do suggest enhanced
potential for large decreases (-10% to -25%) in summer precipitation.
2.1 Overview
Colorado’s Average Climate
Colorado’s climate reflects its mid-continental location, high elevations, and the
complex topography of the mountains, plains, and plateaus. Topographic influences on
weather and climate processes result in large variations in climate over short distances.
Wind, humidity, temperature, and precipitation patterns are all modulated by sharp
changes in elevation and the orientation of mountain ranges and valleys (Doesken et al. 2003).
The state’s interior location results in frequent sunshine, low humidity, and large
variations in daily temperature ranges and annual temperature variability. The distance
from large sources of moisture (i.e., Pacific Ocean and Gulf of Mexico) results in lighter
precipitation for the lower elevations. High mountain ranges benefit from Pacific moisture
moving eastward during the winter months.
Average Temperature
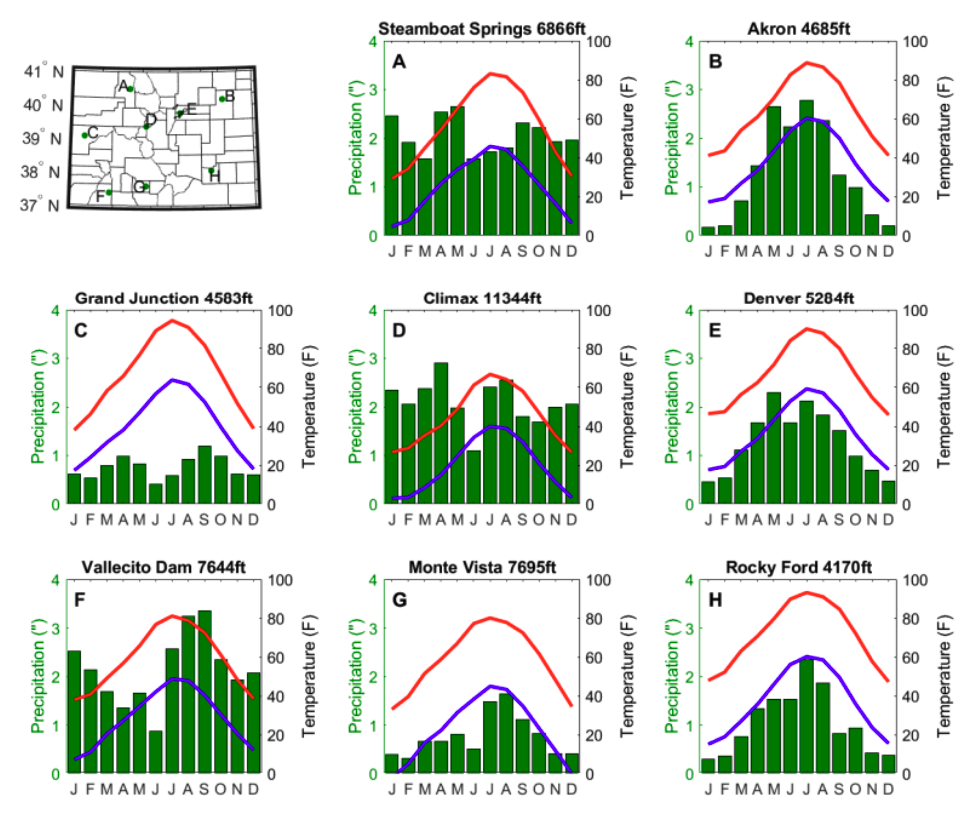
For most parts of the state, on average, January tends to be the coldest month of the
year, and July is the warmest (Figure 2.1). Topography plays a role in temperatures – in
general, temperatures decrease with elevation. Average high elevation temperatures (over
10,000 feet above sea level [asl]) range from single digits in the winter months to 60s
and 70s (°F) in the summer. For lower elevation areas and the plains (elevations around
5,000 ft asl or less), average temperatures dip to the teens in the winter and frequently
top the 90s (°F) in the summer. Middle elevations offer warm temperatures in the summer,
but rarely into the 90s, with frequent single digit temperatures in the winter. Extremes
across the state range from negative temperatures (with winter temperatures observed
below -40°F in the high mountain valleys) to triple digits (over 110°F occurring in the
lower river valleys of the eastern plains of Colorado).
Average Precipitation
Topography also plays an important role in influencing precipitation processes and
patterns. Precipitation typically increases with elevation in all seasons, but especially
in winter when nearly all moisture falls as snow. The seasonal cycle of precipitation is
highly dependent on location (Figure 2.1). The Eastern Plains are generally wetter during
the spring and summer months, with a May peak in northeast Colorado and a July peak in
southeast Colorado. The higher mountain areas tend to be wetter during the winter and
early spring months, and southwest Colorado’s wettest months coincide with the occurrence
of the North American Monsoon in August and September. Annual precipitation totals are
less than 10 inches in the San Luis Valley, while the high mountain ranges typically
receive over 40 inches of liquid precipitation in one year (with amounts observed
between 60 and 80 inches in wet years).
Figure 2.1
1991-2020 normal monthly precipitation (green bars), daily average maximum
(red line) and daily average minimum (blue line) temperatures for eight
National Weather Service Cooperative Observer Program (COOP) stations around
the state. Precipitation in inches and temperature in degrees Fahrenheit.
Locations of the eight stations are labeled on the top left map.
For recent trends and variability in temperature and precipitation, we have relied on
NOAA nClimGrid, a gridded dataset based on weather observations from hundreds of sites
across Colorado, and corrected for biases
from changes in instrumentation, changes in the
daily time of observation, moves in station location and other inhomogeneities. An earlier
version of nClimGrid
was used in the 2014 report. See Appendix A for more information on this dataset and a
comparison with a similar dataset.
For likely future changes in temperature and precipitation, as with the previous two
reports, we relied on the simulations (projections) from global climate models (GCMs).
The 2014 report featured results from the then-latest global archive of GCM projections,
known as CMIP5 (Coupled Model Intercomparison Project, Phase 5; see Appendix A for more
information about the CMIPs). The 2014 report also compared those results from the
previous archive (CMIP3).
In this report, we show results from CMIP5 as well as the most recent archive of GCM
projections (CMIP6) that was released in 2020-21. The projections from CMIP6 have not yet
been used to generate basin-scale projections of hydrology and water resources (such as
in Chapter 3); thus, we have chosen to emphasize CMIP5 projections throughout Chapters 2,
3, and 4 to maintain consistency among the analyses. We also examine the differences
between the CMIP5 and CMIP6 projections for Colorado.
×
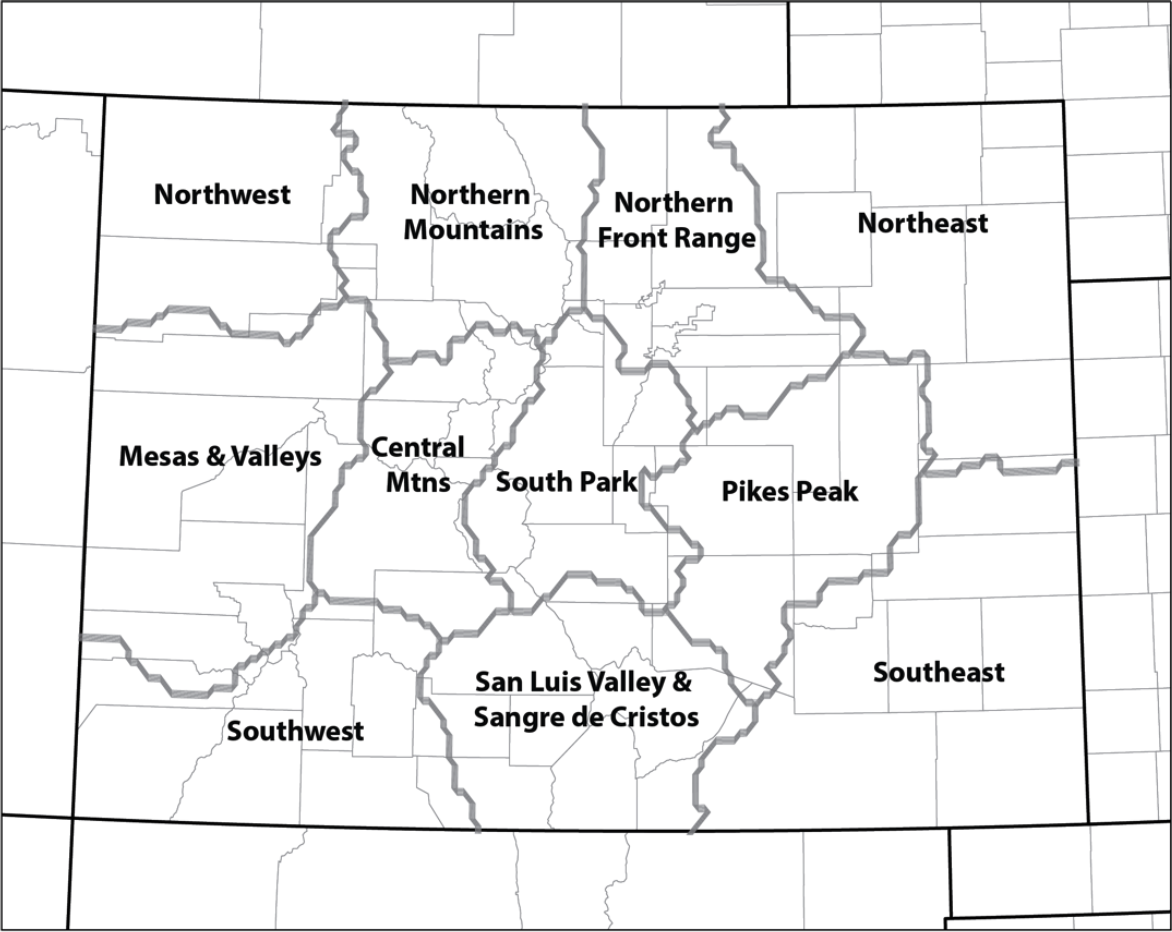
Alternate Climate Divisions
NOAA’s official set of climate divisions for the U.S. (Guttman and Quayle 1996)
splits Colorado into five divisions that correspond to the large river basins in
the state (the Arkansas, Platte, Rio Grande, Colorado, and Republican). However,
there are limitations of these divisions for climate analysis and monitoring. For
example, all of western Colorado is included in a single climate division, even
though the climates (and
climate variability)
of northwest and southwest Colorado
have major differences. Wolter and Allured (2007) developed a method for alternate
divisions based on seasonal variability at long-term stations, and an adaptation
of these divisions was used in the 2014 Climate Change in Colorado report. For
this report update, we applied the Wolter and Allured method of hierarchical
cluster analysis to monthly gridded data from 1950-2021 to establish a set of
11 alternate climate divisions that are used throughout this report (Figure 2.2).
These divisions have the advantage of providing information that is more granular
than the existing climate divisions, and more representative of available data
than county-level calculations (Schumacher et al. 2024).
Figure 2.2
The eleven alternate climate divisions, with names assigned by the authors
based on how they are often referred to in relation to climatology or local
convention.
The most fundamental and pervasive effect of anthropogenic (human-caused) climate change
is an overall warming of the climate system. This global warming has manifested in nearly
all regions of the world in the past several decades.
Observed temperature changes
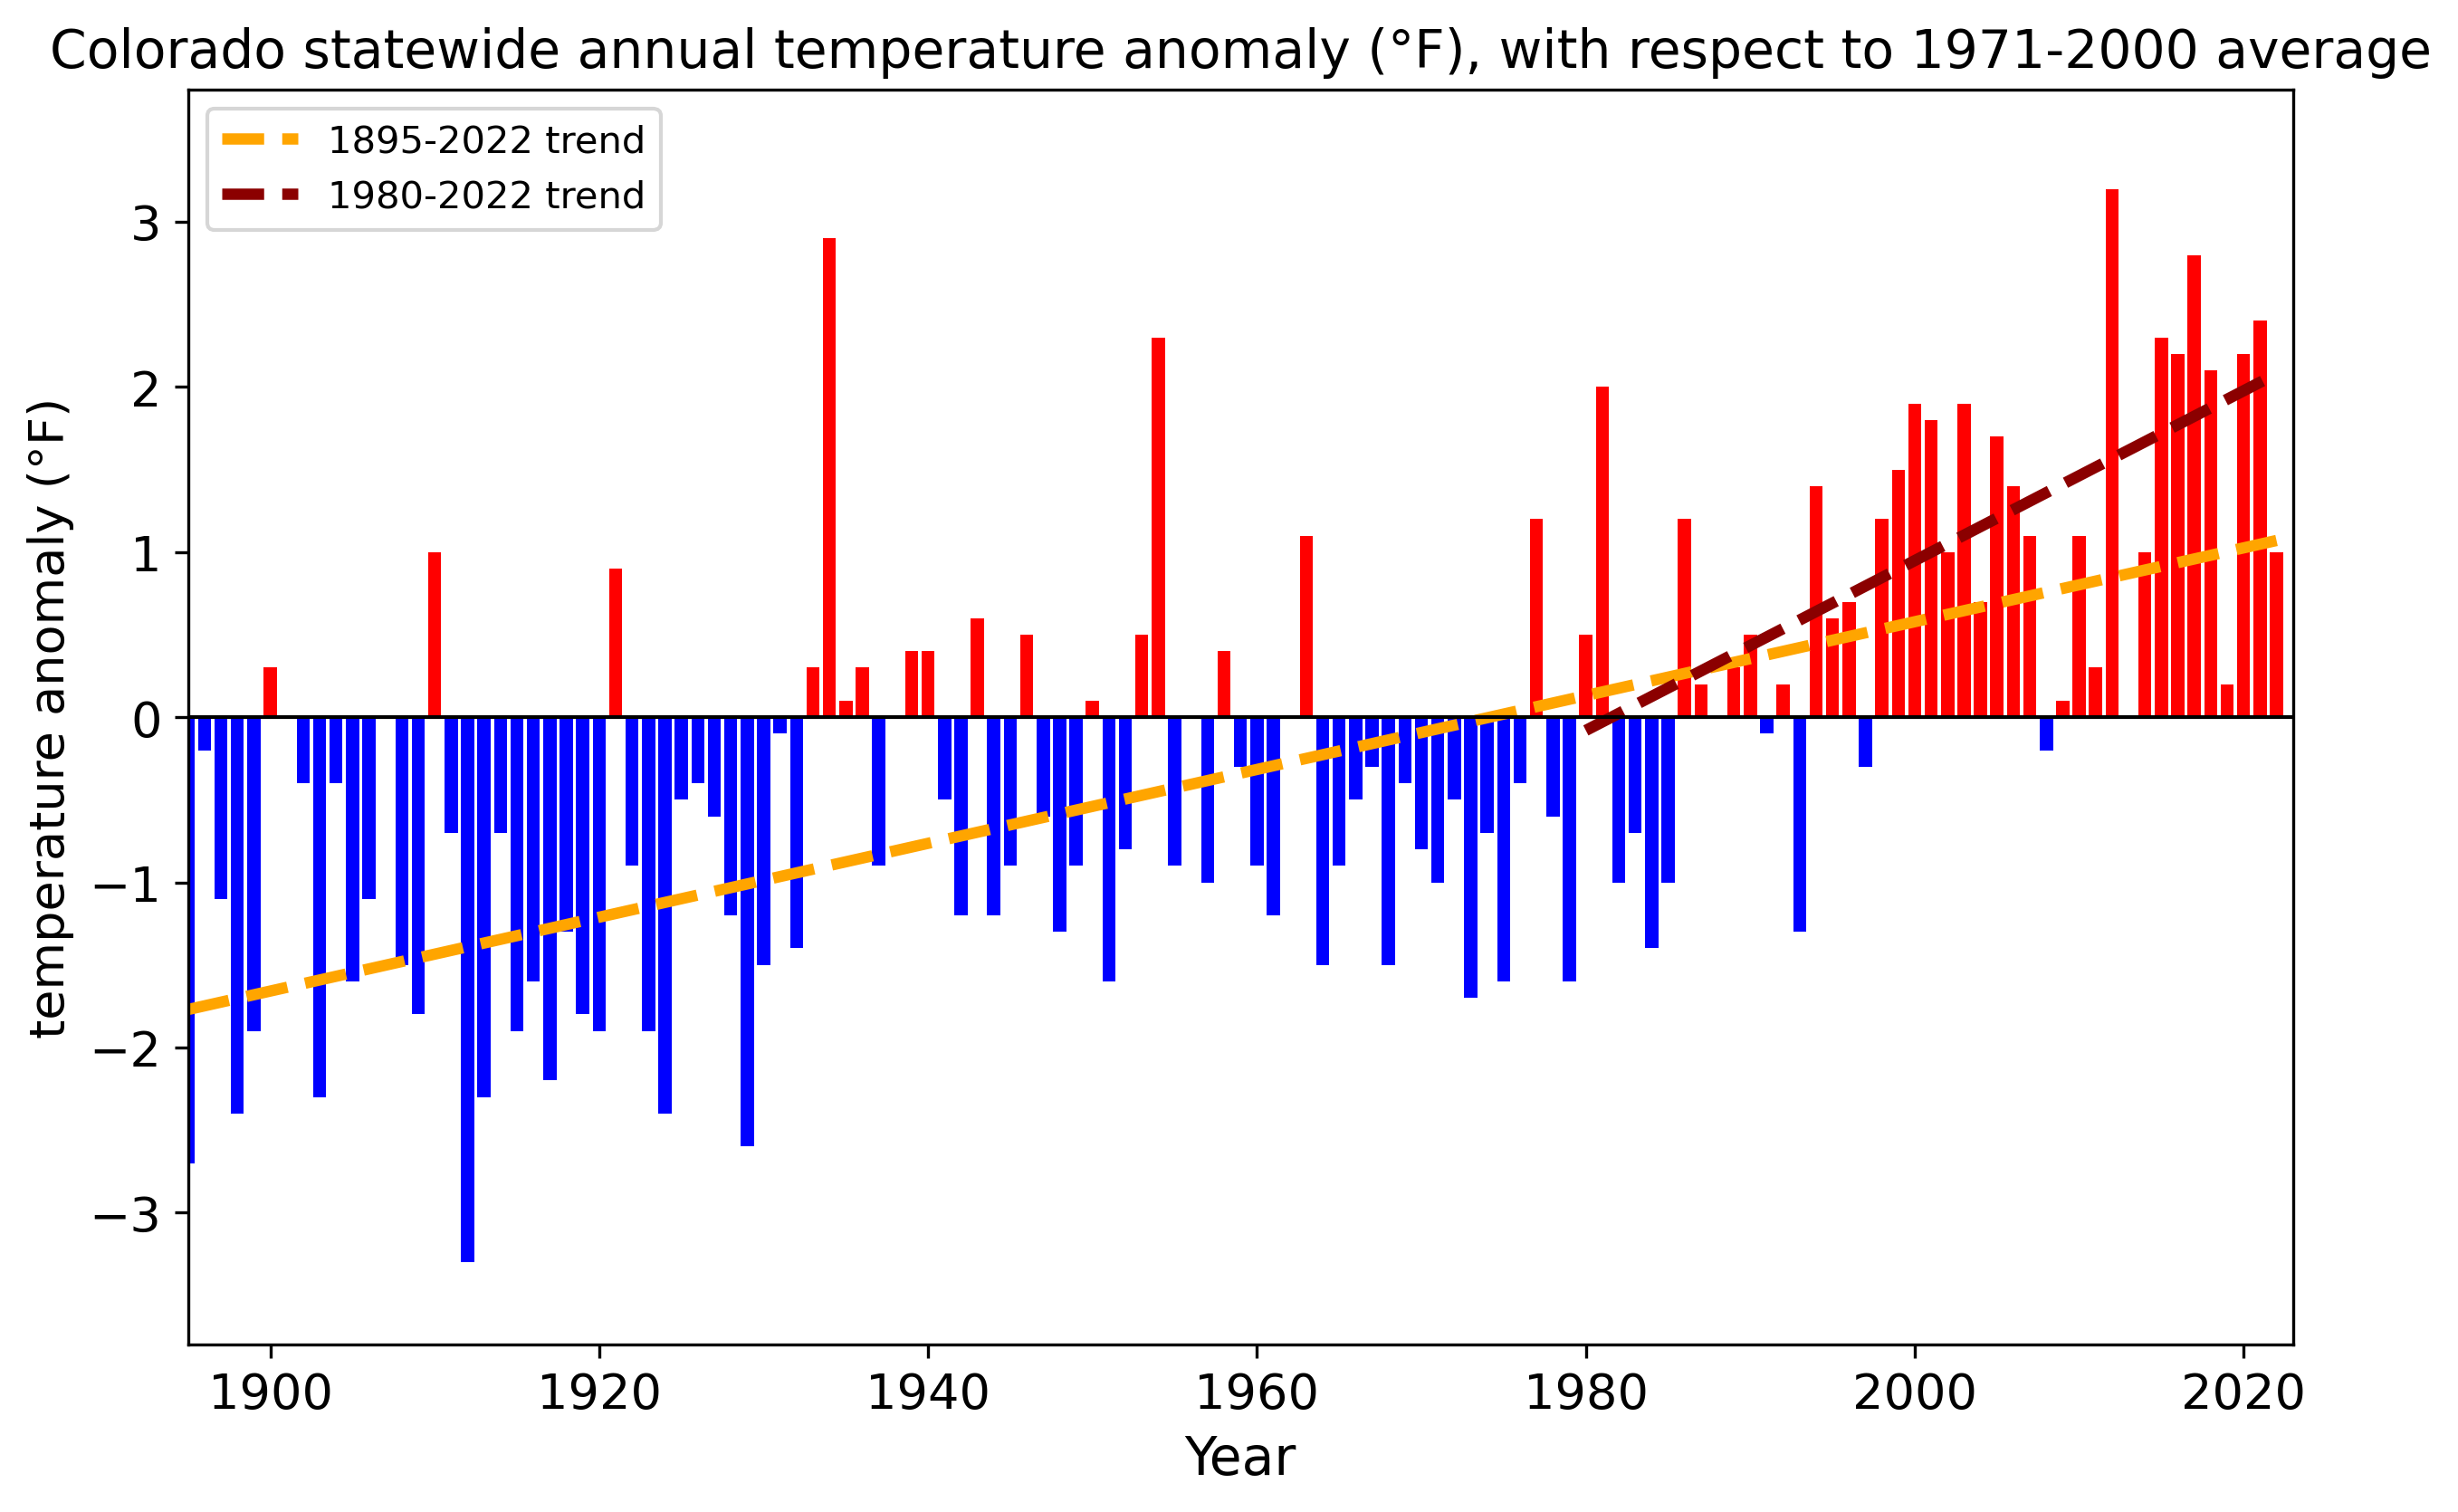
Colorado statewide temperatures have warmed since systematic instrumental observation
records began in the late 19th century (Fig. 2.3). When compared to the 1971-2000 average,
only one year in the 21st century had below-average annual temperature. Seven of the top
10 hottest years on record have occurred since 2010. Recent mean temperatures (2001-2022)
have averaged 1.4°F warmer than the 1971-2000 average (45.1°F).
Figure 2.3
Colorado statewide temperature anomaly (°F) with respect to the 1971-2000
average of 45.1°F. The 1895- 2022 trend (yellow dashed), and 1980-2022 (red dashed) lines are included.
We analyzed temperature changes by season, both long-term (from 1895-2022) and more recent
trends (1980-2022). From 1895-2022, the winter season (Dec-Jan-Feb) shows the greatest
warming (Table 2.2). However, since 1980, winter warming has diminished, largely due to
recent cooling observed in February. Fall season (Sep-Oct-Nov) temperatures have warmed
more than any other season for 1980-2022 (Table 2.2). While all seasons have exhibited
increasing trends in both short- and long-term periods, with seasonal changes ranging
between +1°F to +3°F for the 1980-2022 period.
Statewide
1895-2022 change
1980-2022 change
Winter
+3.3°F
+1.0°F
Spring
+2.6°F
+1.7°F
Summer
+2.7°F
+2.5°F
Fall
+2.1°F
+3.1°F
Annual
+2.9°F
+2.3°F
Table 2.2: Changes in statewide average annual and seasonal temperature as calculated by
the linear trend, 1895- 2022 (middle column) and 1980-2022 (right column).
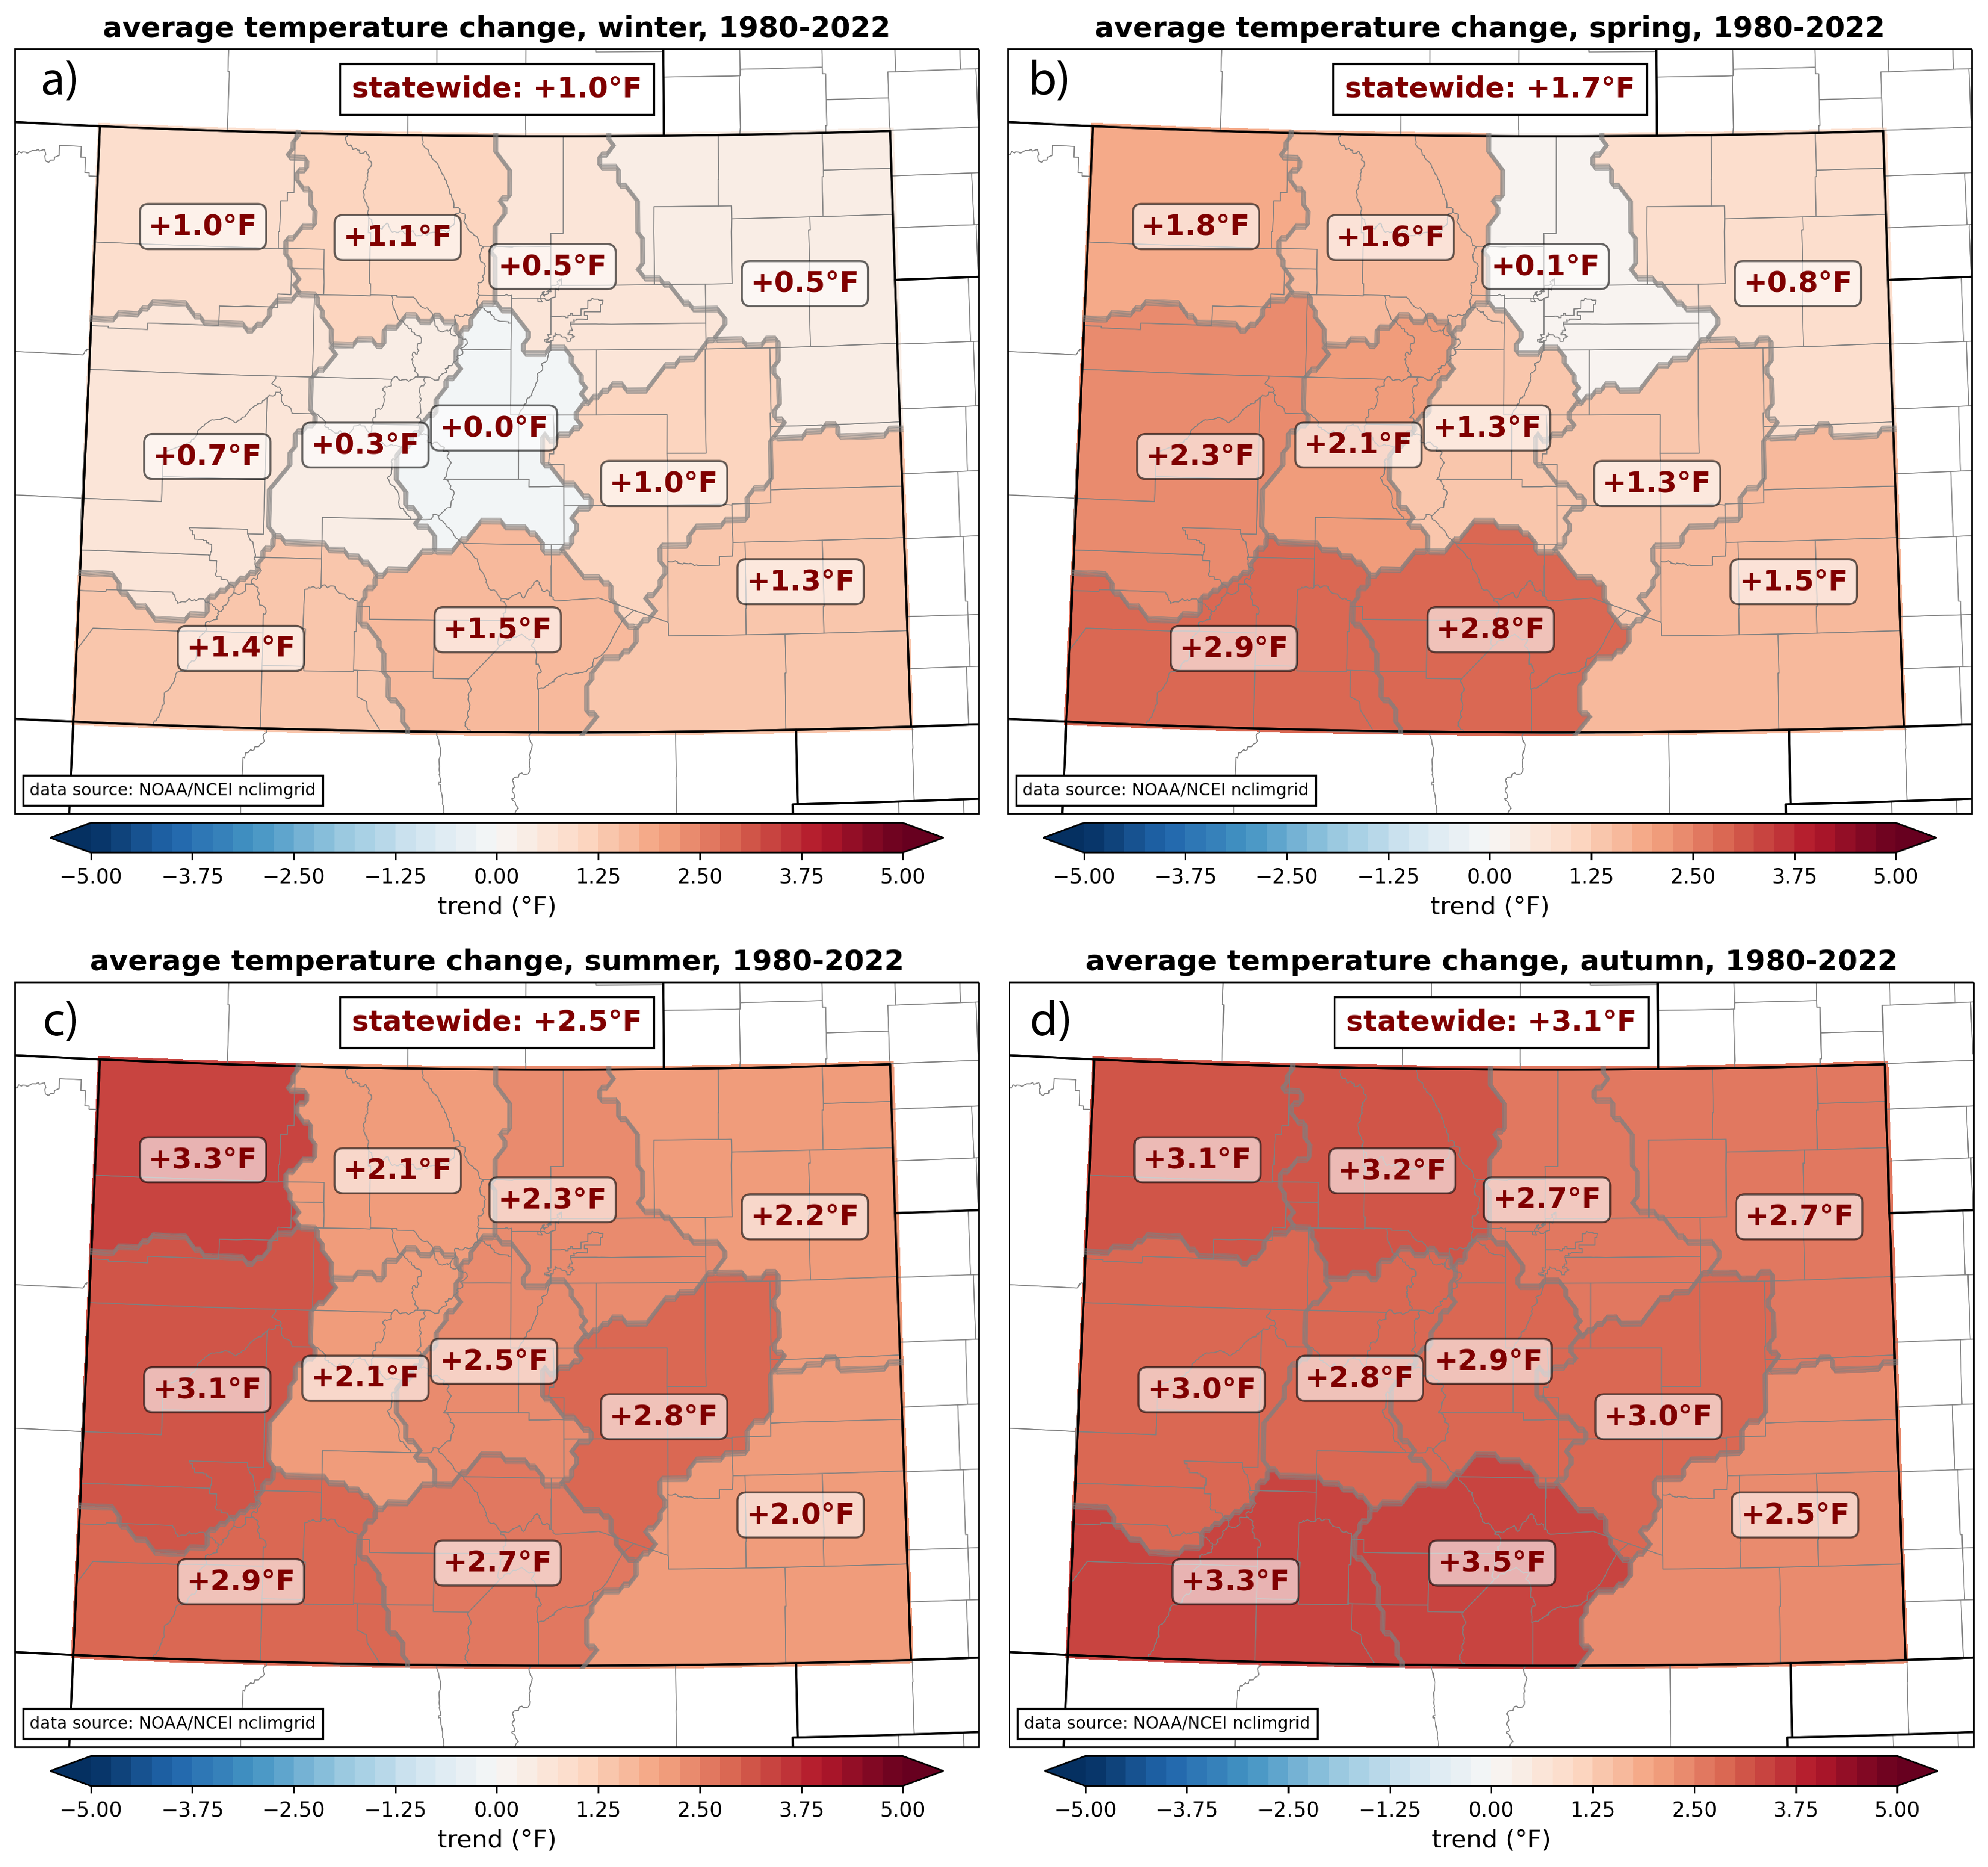
We also analyzed seasonal and annual temperature changes for each of the 11 alternate
climate divisions (see sidebar for description of climate divisions). Figure 2.4 shows
the seasonal changes in temperature for each division for the recent period of 1980 to
2022. Most notably, the greatest warming has occurred in the fall (Fig. 2.4d) for each
climate division. Summer warming has also been significant (Fig. 2.4c), with larger
changes in the western climate divisions. The south and the west have observed more
warming in the spring (Fig. 2.4b). The Northern Front Range (including the majority of
the state’s population) has experienced little to no warming in spring, while the Central
Mountains and South Park area experienced little to no warming during the winter
(Fig. 2.4a). Annually, the greatest warming has been observed over the Southwest and
San Luis Valley climate regions.
Figure 2.4
Changes in observed climate division temperatures, 1980-2022, for (a) winter,
December-January-February, (b) spring, March-April-May, (c) summer, June-July-August, and
(d) fall, September-October-November.
The pervasive observed warming trends across Colorado are comparable, in terms of timing
and magnitude, to warming trends that have been observed regionally, nationally, and
globally. At the global scale, human influence has been the main driver of observed
warming in the past several decades (USGCRP 2017,
IPCC 2021). The warming trend in the
southwest U.S., including Colorado, has likewise been primarily attributed to human
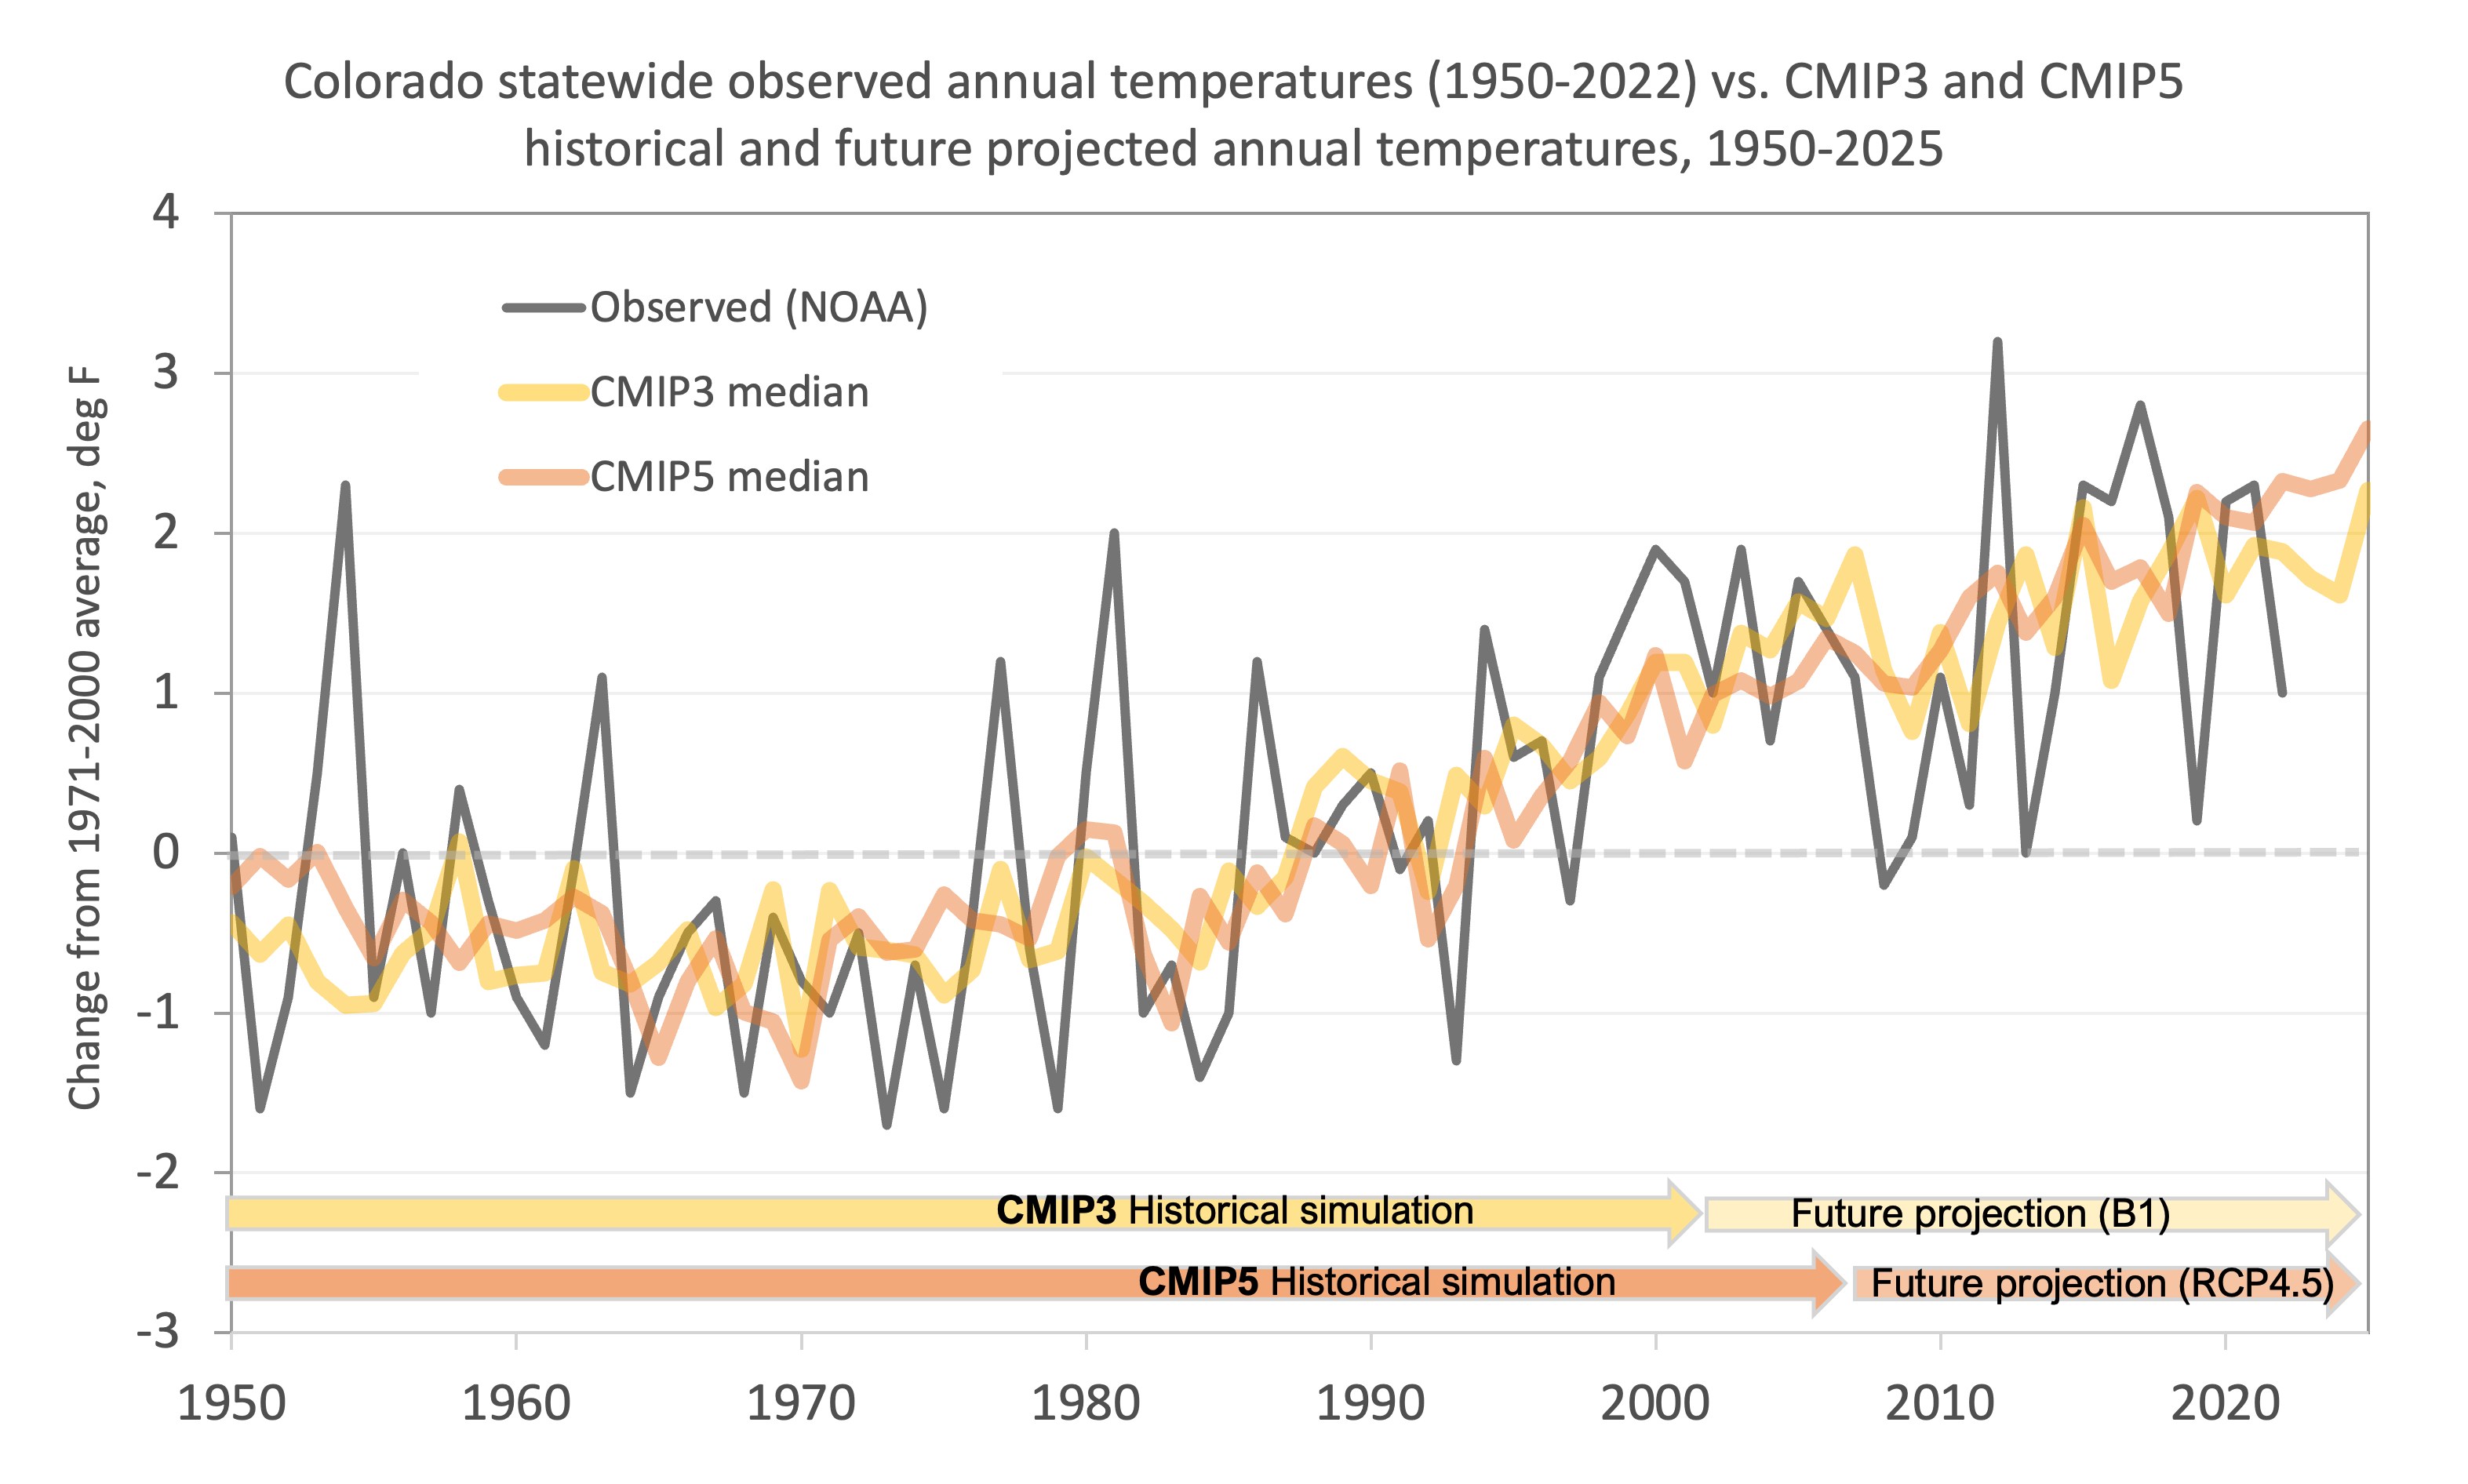
influence (Lehner et al. 2018). Figure 2.5 shows that the trajectory of observed annual
average temperature for Colorado (gray) since 1950 is comparable to the trajectories of
median modeled temperatures from the CMIP3 (yellow) and CMIP5 (orange) climate model
ensembles. These model runs assume greenhouse gas emissions and atmospheric concentrations
similar to what has actually occurred through 2022. The similarity between the observed
and modeled statewide warming trends is consistent with the evidence at broader spatial
scales that indicates human influence has played a substantial role in Colorado’s recent
warming trend.
Figure 2.5
Observed statewide annual average temperatures 1950-2022 (same data as in
Figure 2.3), compared with the median historical simulation plus the median future
projection from the CMIP3 and CMIP5 climate model ensembles, respectively.
(Data: Observations: NOAA NCEI nClimGrid, https://www.ncei.noaa.gov/cag/; CMIP3 and CMIP5
projections: GDO-DCP, https://gdo-dcp.ucllnl.org/)
There is very high confidence that the climate of Colorado will continue to warm in all
seasons through the mid-21st century, given our understanding of the physical
mechanisms for warming, the observed warming trend, and climate model projections. While
the magnitude of warming is uncertain, by 2050, Colorado’s average annual temperatures
will likely match or exceed the very warmest years of the past, bringing large changes
in the frequency and severity of heat waves, as we will discuss in Section 4.1. Note that
in the analyses below, we focus on the medium-low emissions scenario RCP4.5, used for
the CMIP5 climate model runs, and its counterpart SSP2-4.5, used for the CMIP6 model
runs. The section “Emissions Scenarios” in Appendix A explains why we focused on these
scenarios and provides more information about these and other emissions scenarios.
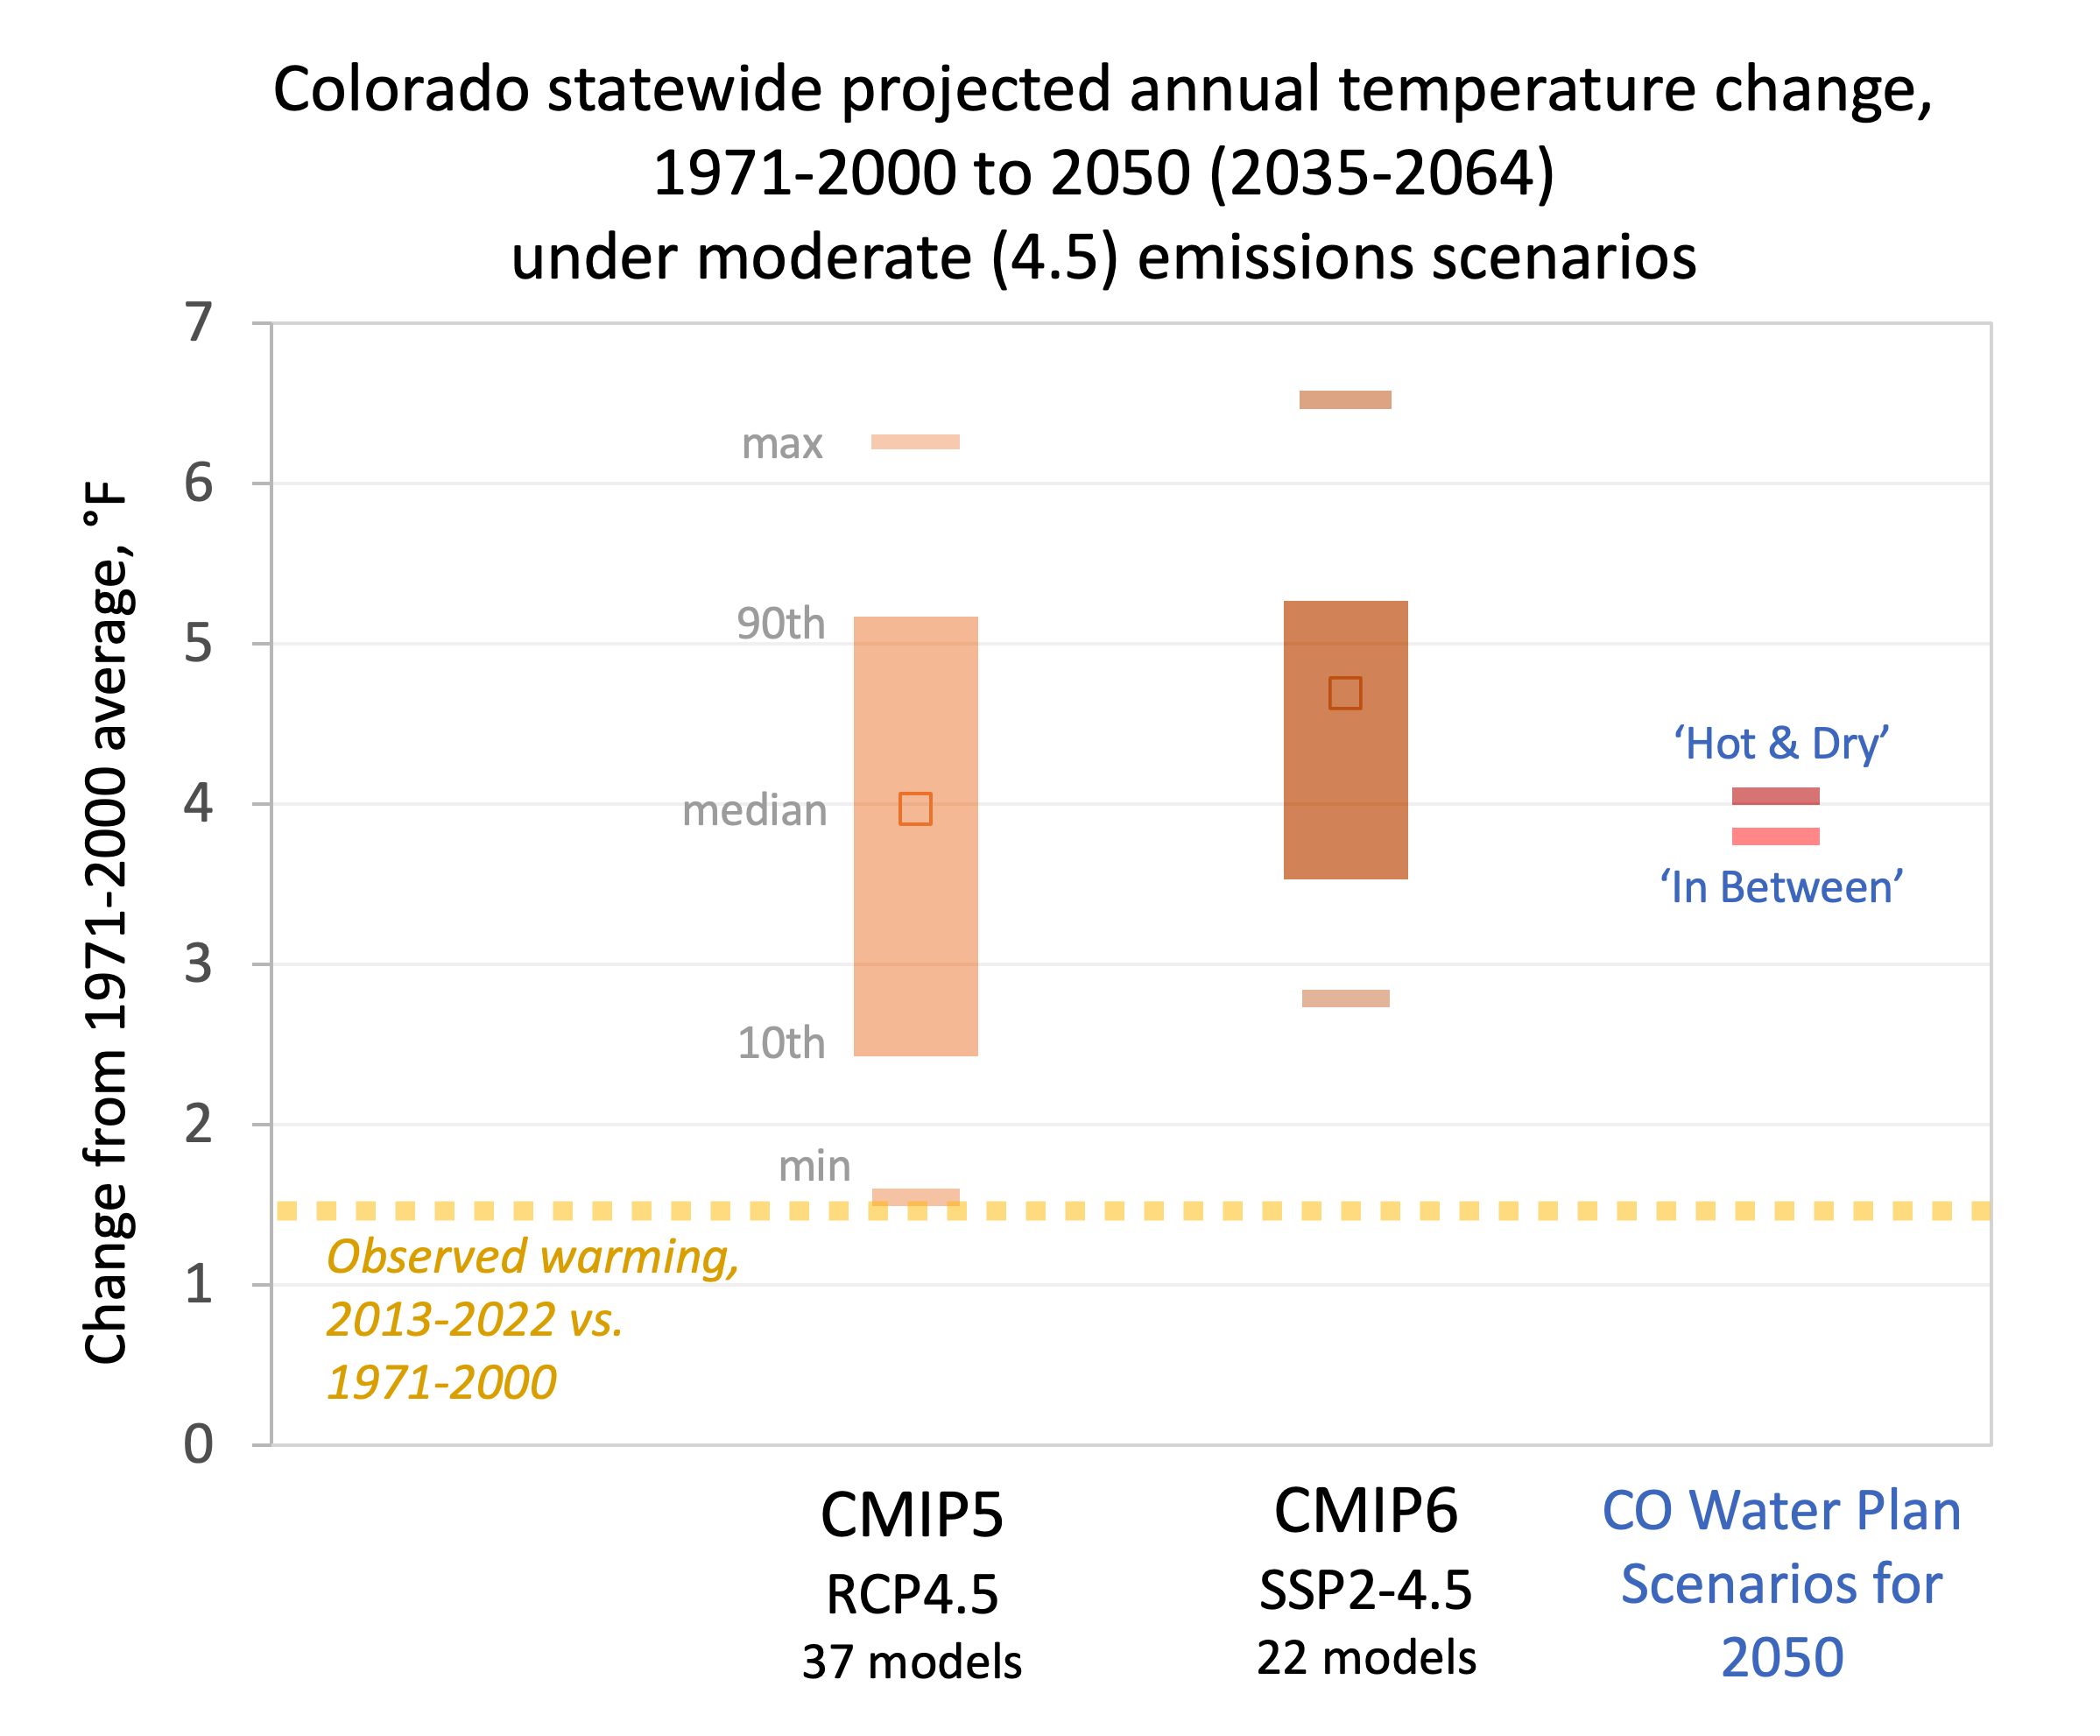
Under RCP4.5, Colorado statewide annual temperatures are projected by the CMIP5 climate
models to warm by +2.5°F to +5°F compared to the late 20th century (1971-2000) average
(Figure 2.6). We continue to use this 1971-2000 baseline to maintain consistency with
the analysis of climate projections in the 2008 and 2014 reports, and in
other state reports such as the Colorado Water Plan. Colorado has
already warmed by about 1.5°F beyond this baseline, as detailed below.
Figure 2.6
Projected future temperature change for Colorado statewide for a 2050-centered period
(2035-2064) relative to 1971-2000, from the CMIP5 and CMIP6 climate models under
medium-low emissions scenarios. The solid orange bars show the middle 80% of the model
projections (10th-90th percentiles); the two orange dashes show the minimum and maximum
projections; the open squares show the median projections.
Under a comparable emissions scenario (SSP2-4.5), the CMIP6 models show a range of
warming that is shifted upward, especially at the low end, compared to CMIP5, showing
+3.5°F to +5°F warming for Colorado, as taken from the 10th to 90th percentiles of the
projected values. The two red bars on the right side of Figure 2.6 show that the climate
change scenarios for 2050 used in the Colorado Water Plan (CWCB 2015, CWCB 2023) are
within the range of both CMIP5 and CMIP6 under 4.5 emissions scenarios. It is not
surprising that the CMIP6 models show overall warmer futures for Colorado than CMIP5,
since the global temperature response of the CMIP6 models given additional increments of
greenhouse gases (i.e., climate sensitivity) is overall higher than for the CMIP5 models
(see Appendix A for more detail on the CMIP6 “hot” model issue).
It is important to remember that Colorado has already observed, through 2022, a
substantial fraction of the projected warming relative to the 1971-2000 baseline: about
+1.5°F, depending on the calculation method (Fig. 2.6). Thus, the projected statewide
warming for 2050 shown by the CMIP5 models is +1.0°F to +3.5°F relative to “today”, and
in the CMIP6 models, +2.0°F to +3.5°F relative to today. The fact that Colorado has
already experienced +1.5°F of warming relative to 1971-2000 suggests that the
lowest-warming projections in the CMIP5 ensemble, below the 10th percentile, are now very
unlikely outcomes.
Most of the projections under a medium-low (4.5) emissions scenario, whether from CMIP5 or
CMIP6, show a mid-century climate that is, on average, at least 3°F warmer than the
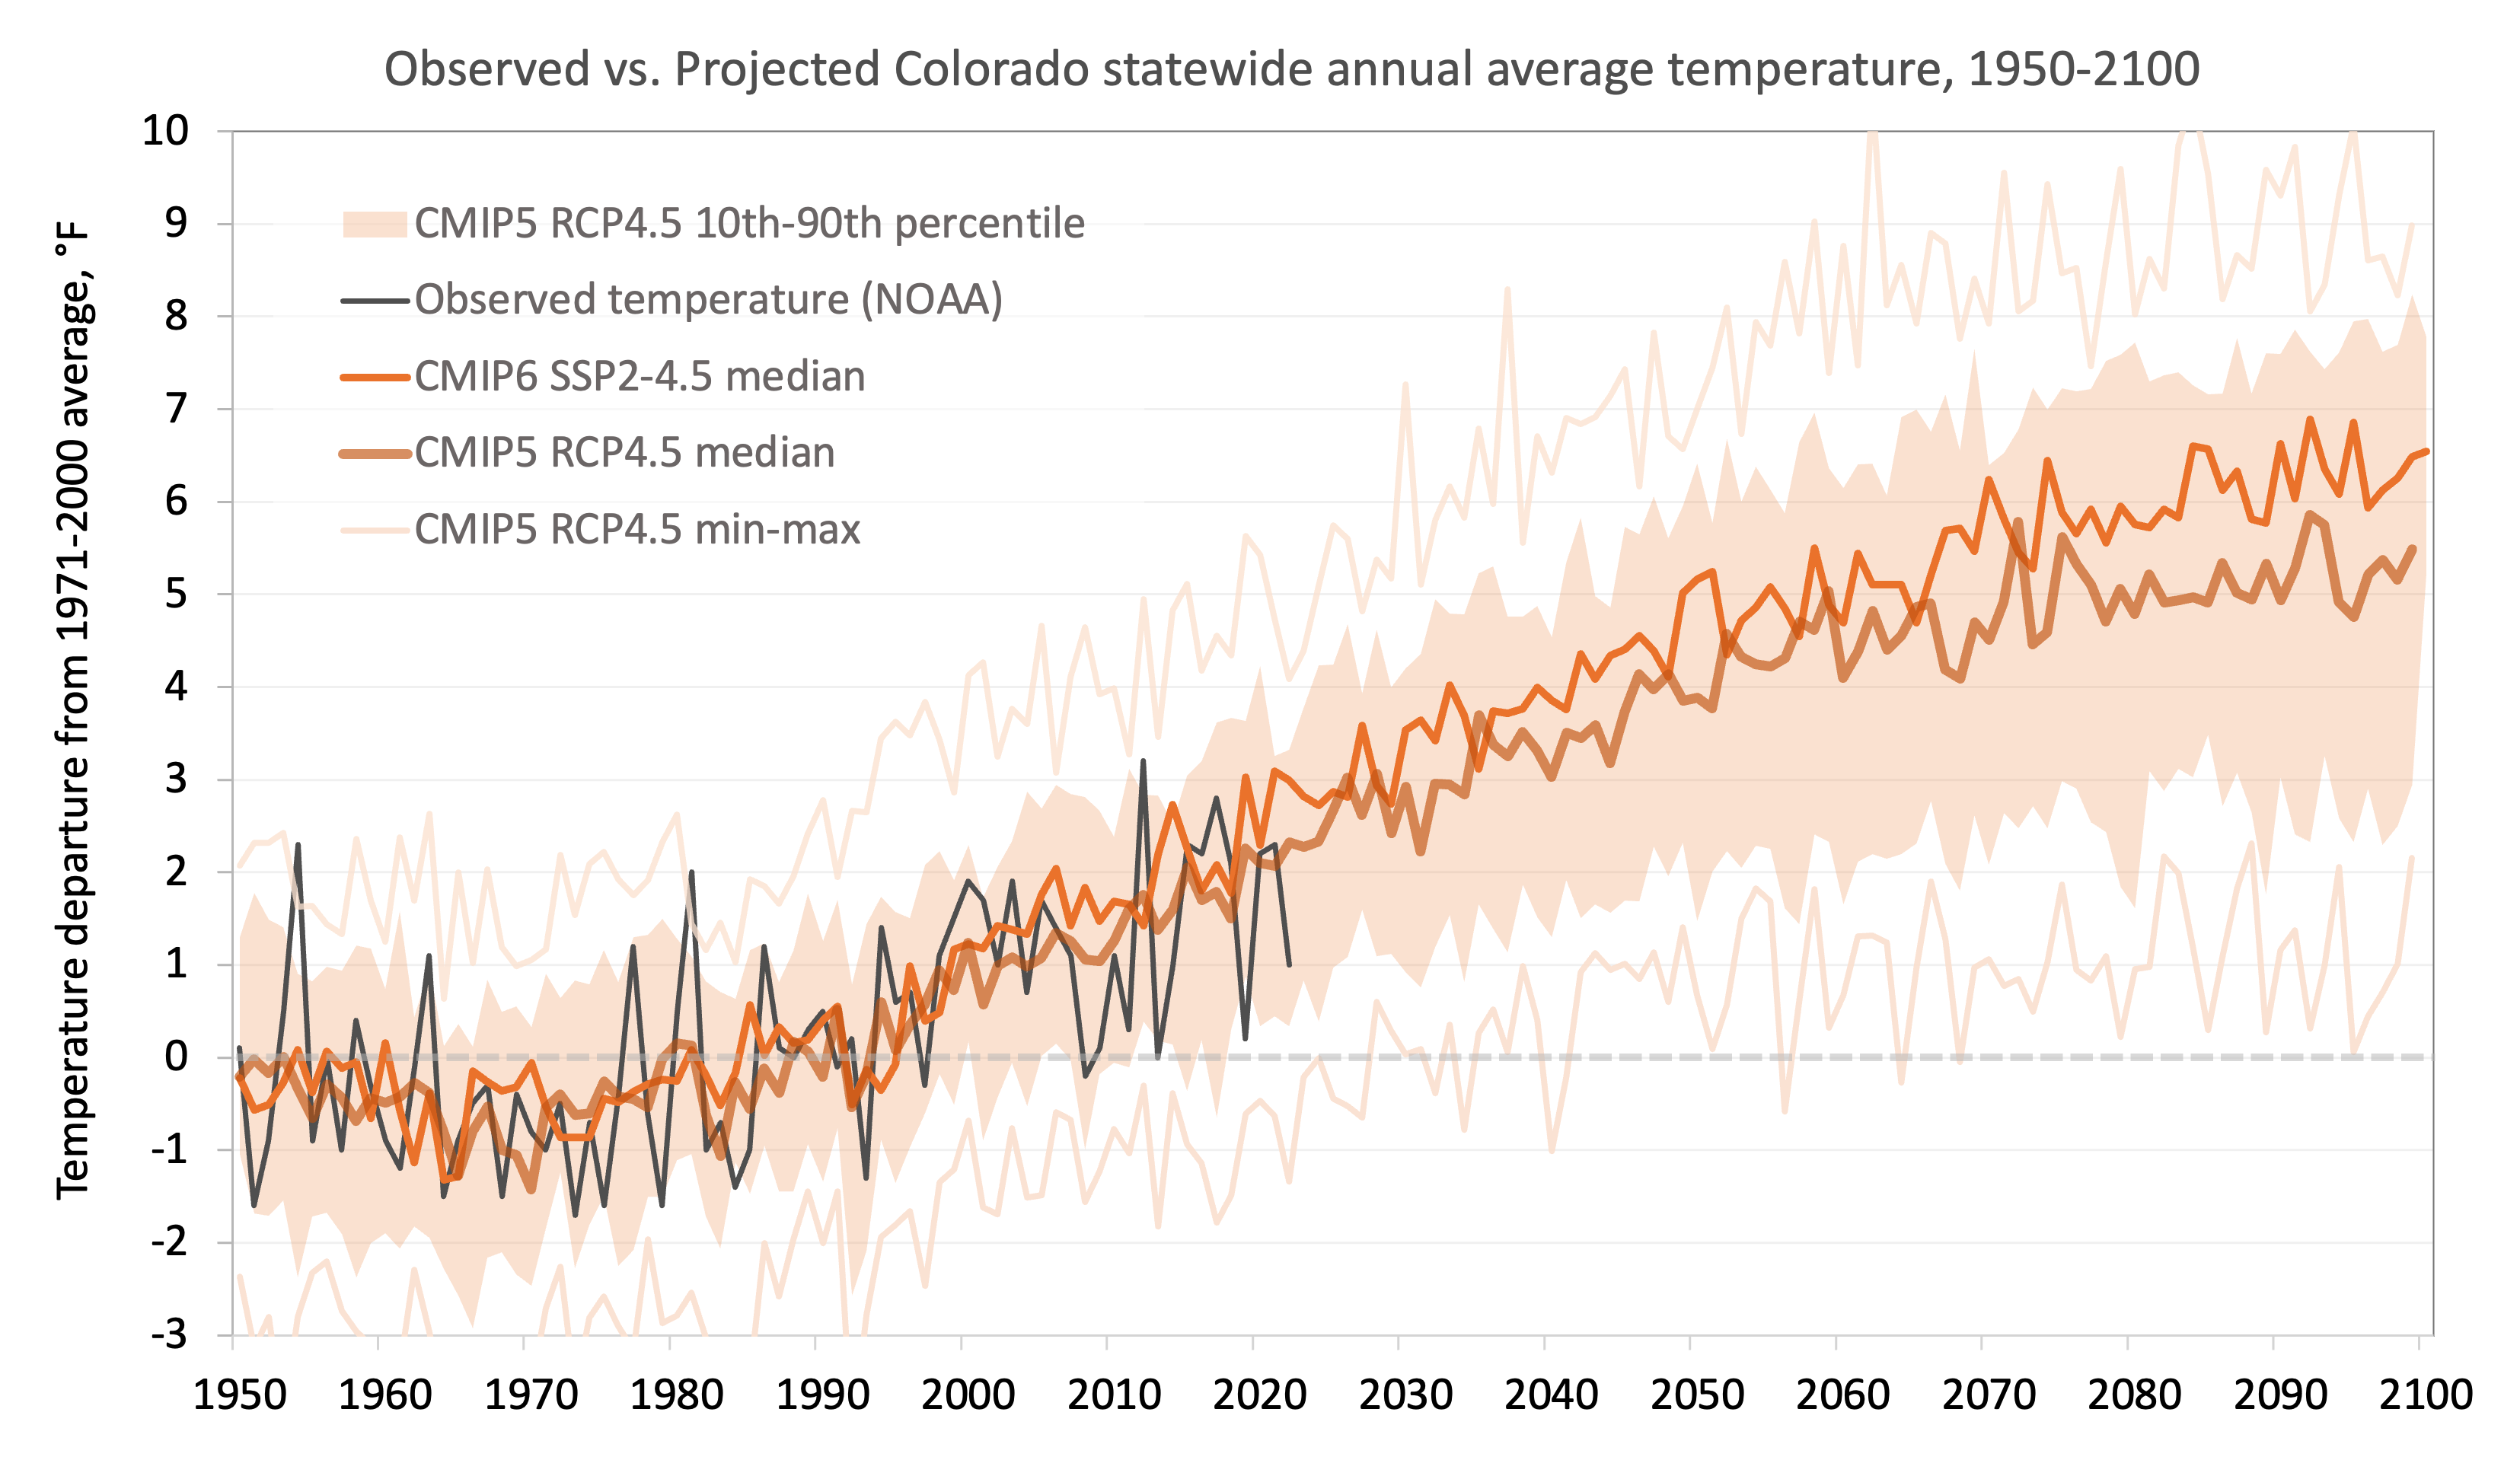
1971–2000 baseline. If this does occur, an “average” year in 2050 will be warmer than the
very warmest individual years observed through 2022 (Figure 2.7).
For a later future period centered on 2070 (2055-2084), the CMIP5 models under medium-low
(RCP4.5) emissions scenario projects Colorado statewide temperatures to have warmed
+3.0°F to +6.5°F of warming relative to 1971-2000, and +1.5°F to +5.0°F of warming
relative to today. For the same 2070-centered period, the CMIP6 models under a comparable
emissions scenario (SSP2-4.5) show warming of +4.0°F to +7.0°F relative to 1971-2000, and
so +2.5°F to +5.5°F of warming relative to today. As seen in Figure 2.7, the difference
between the CMIP5 and CMIP6 median warming under the 4.5 scenarios increases to about
1.0°F by 2070.
Figure 2.7
Projected change in Colorado statewide average annual temperatures to 2100, relative to
a 1971-2000 baseline, from CMIP5 models (median and range) and CMIP6 models (median only)
under medium-low emissions scenarios (RCP4.5, SSP2-4.5), compared to observed
temperatures through 2022.
With continued warming over the next few decades, the future temperatures at every
location in Colorado will become more like those currently experienced in places that are
to the south, or lower in elevation. With 2°F of further warming, the seasonal
temperature regime for Denver would become more like the current temperatures in Pueblo.
With 4°F of further warming, Denver’s temperature regime would be similar to Lamar today.
With 6°F of further warming, Denver’s temperatures would be slightly warmer than the
current temperatures in the warmest parts of the lower Arkansas Valley (Las Animas and
La Junta), and similar to Albuquerque, New Mexico. Note that this comparison only speaks
to temperatures, not precipitation; Denver is very unlikely to experience a large
decline in precipitation that would make the overall climate like Albuquerque's, even
with 6°F of warming.
Under a given emissions scenario (e.g., RCP4.5), the differences in warming across the
various projections have two sources. The primary one is that the various climate models
have different inherent sensitivity to each increment of greenhouse gases, because of
how physical feedbacks are represented in each model. The second and lesser source is
the “noise” of model-simulated natural (internal) variability. The 30-year averaging
period (e.g., 2035-2064) used here is designed to reduce this noise, but some projections
will happen to simulate a relatively warmer, or cooler, few decades in the middle of
the longer-term warming trend, and we cannot easily distinguish the noise from the
background signal (the warming trend). The effect of this noise is more problematic for
the precipitation projections than for temperature projections, as will be discussed in
section 2.3.
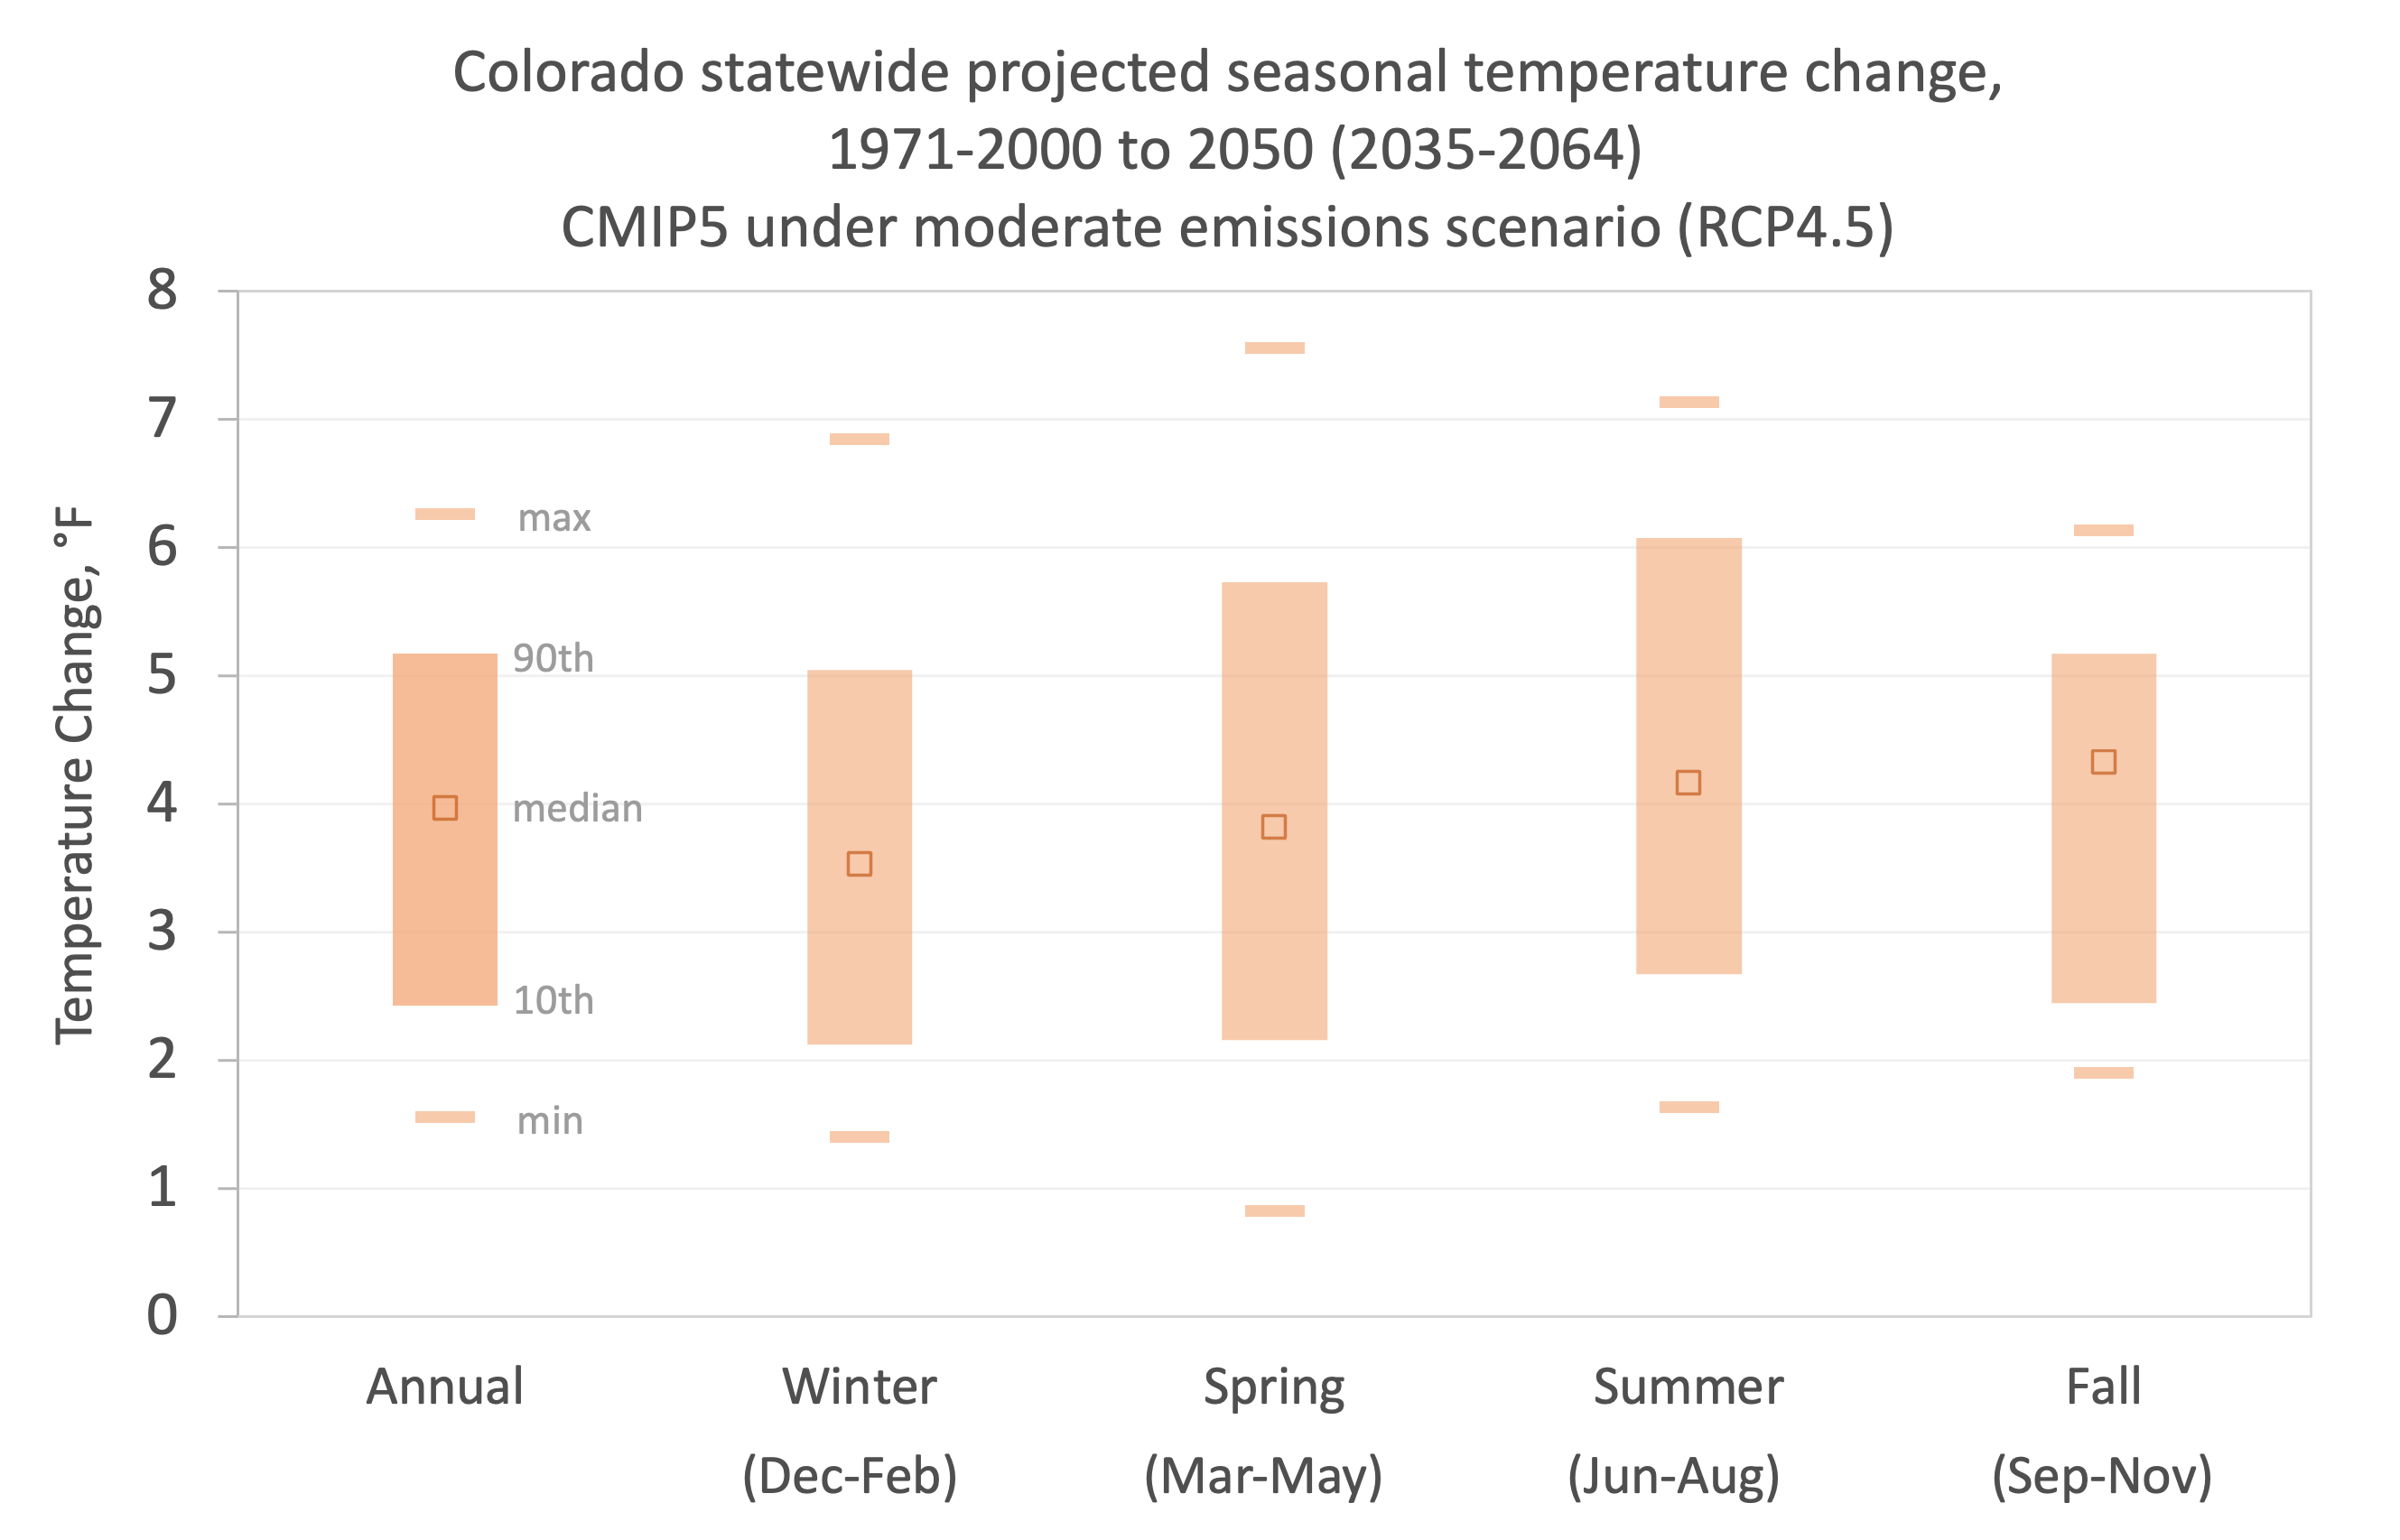
Figure 2.8 shows the statewide seasonal temperature changes projected by CMIP5 models
under RCP4.5, using the same data as shown in Figures 2.6 and 2.7. Overall, summer and
fall show slightly greater future warming than winter and spring, though the differences
between the seasons are relatively small compared to the magnitude of the overall
projected warming. The CMIP6 models show the same pattern: summer and fall are expected
to warm slightly more than winter and spring.
Figure 2.8
Projected future change in seasonal temperatures for Colorado statewide for a
2050-centered period (2035-2064) relative to 1971-2000, from CMIP5 (36 models/projections)
under a medium-low emissions scenario (RCP4.5). The solid orange bars show the middle
80% of the model projections (10th-90th percentiles); the two orange dashes show the
minimum and maximum projections; the open squares show the median projections.
The “raw” output from climate models provides useful estimates of future climate changes
at the global scale down to statewide scales. But the spatial resolution of the data,
generally 100-km (60-mi) to 300-km (180-mi) grid boxes in the midlatitudes, is too
coarse to adequately represent the complex terrain of Colorado and its effects on
climate, or for the data to be used as inputs for watershed hydrology modeling or other
impact modeling. Thus, global climate model output is typically downscaled through
statistical methods, or via higher-resolution regional climate models (RCMs), in order
to better represent localized changes to weather and climate, and to facilitate further
modeling. The process of downscaling also includes a
bias-correction
step which adjusts
for systematic biases or offsets between the model-projected climate at regional scales
and the observed historical climate, over the period of overlap between the two (e.g.,
1950-2005).
For a closer look at how the projected future climate change may vary in different areas
in Colorado, we analyzed the CMIP5-LOCA (LOcalized Constructed Analogs) statistically
downscaled climate projection dataset developed by Pierce et al. (2014). These projections
were not available at the time of the 2014 Report, but they have since been used in
many climate assessments and studies, including USGCRP (2017, 2018),
Lukas et al. (2020),
and Reclamation (2021).
Taking the 11 alternative climate divisions described earlier in
this chapter, we obtained CMIP5-LOCA data for a 0.75° x 0.75° (40 mi./64 km x 52 mi./83
km) quadrangle within each division.
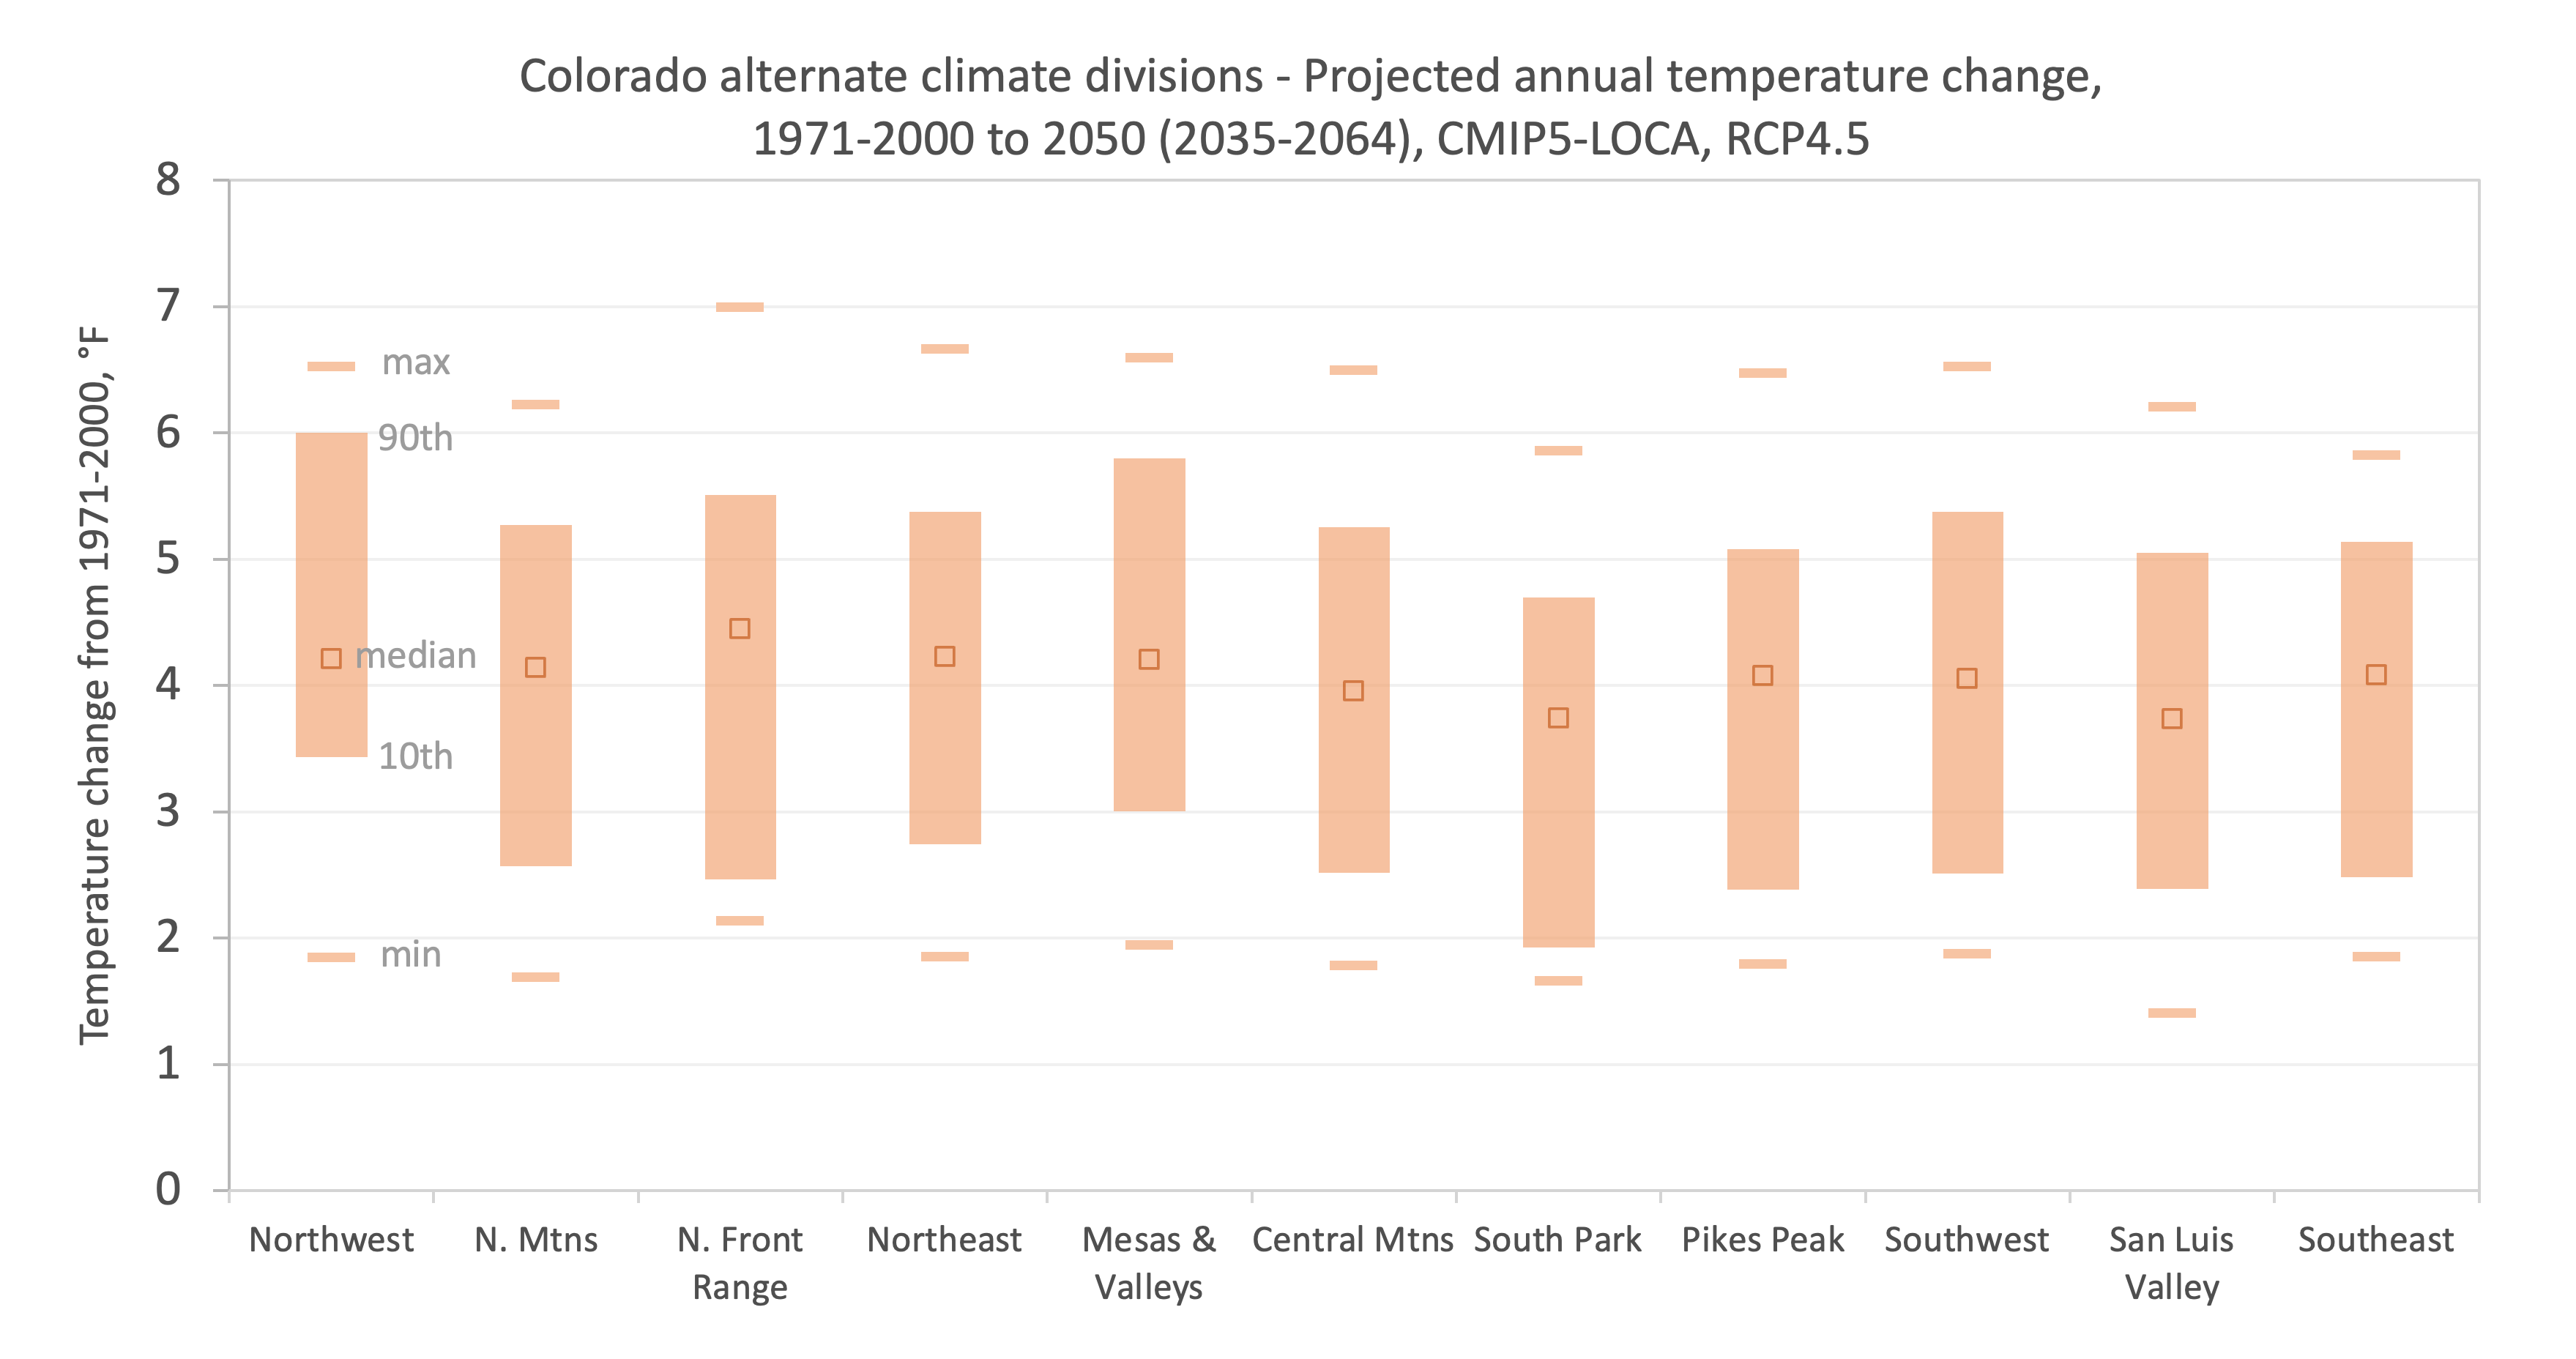
Figure 2.9 shows the projected change in annual average temperature under RCP4.5 between
the historical baseline (1971-2000) and the 2050-centered future period (2035-2064) for
the 11 alternative climate divisions. All of them are expected to see substantial future
warming into this mid-century period. Slightly greater future warming is generally seen
in the divisions in Western Colorado and the northern Front Range, with slightly less
warming seen in South Park and the San Luis Valley divisions. Keep in mind that these
differences in the projected changes in average temperature between the divisions, which
are at most 0.7°F, are much smaller than the overall warming across all divisions
(median: 4.1°F), or the uncertainty in the warming across the ensemble of 32 projections
(generally ± 2°F). The key point is that all parts of the state are expected to warm at
rates that are similar to the statewide average.
Figure 2.9
Projected future change in annual average temperature in 11 alternative Colorado climate
divisions for a 2050-centered period (2035-2064) relative to 1971-2000, from an ensemble
of 32 CMIP5-LOCA climate projections under a medium-low emissions scenario (RCP4.5). The
solid orange bars show the middle 80% of the model projections (10th to 90th percentiles);
the two orange dashes show the minimum and maximum projections; the open squares show the
median projections.
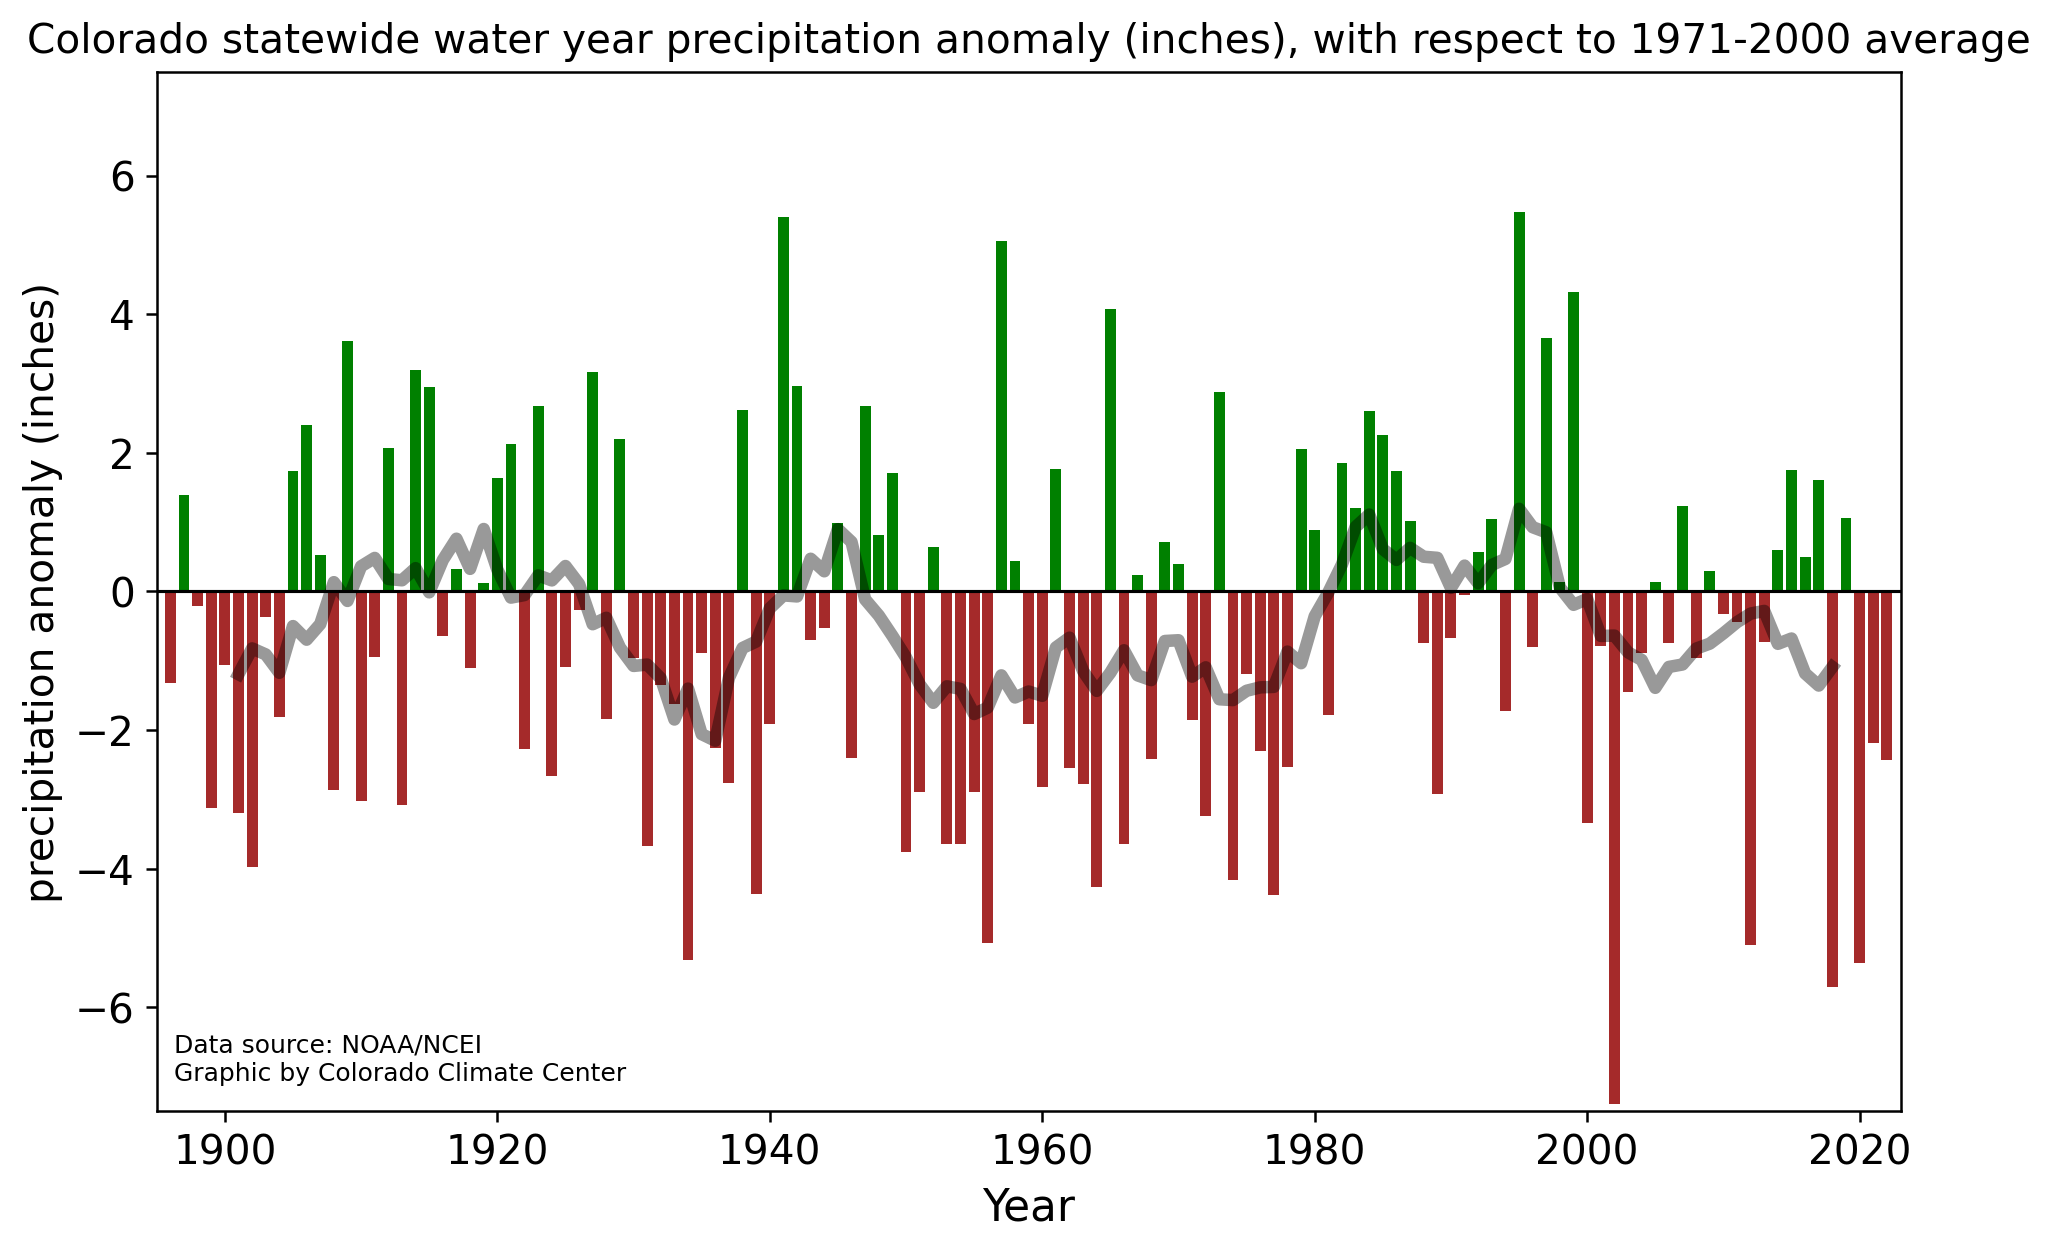
In Colorado, statewide precipitation exhibits high variability at both year-to-year and
longer-term decadal timescales (Figure 2.10). With respect to the 1971-2000 average,
annual precipitation has varied from 6 inches below average to 6 inches above average.
The smoothed time series (Fig. 2.10, gray line) shows frequent extended dry periods with
wet periods in between.
Figure 2.10
Colorado statewide water year precipitation anomaly (inches) with respect to the
1971-2000 average of 18.51 inches. Smoothed 10-year running mean (gray line) included.
Since the relatively wetter periods of the 1980s and 1990s, Colorado has experienced more
persistent dry conditions since 2000. The differences in precipitation and temperature
variability necessitate different approaches in analyzing their changes. Rather than
calculating a linear trend, we calculate the difference in precipitation between the
period 2001-2022 and the period 1951-2000. Statewide, precipitation was 4% lower in
2001-2022 compared to the 1951-2000 average (Table 2.3). These decreases have largely
been concentrated in spring, summer, and autumn.
Statewide
Change from 1950-2000 to 2001-2022
Winter
+3%
Spring
-7%
Summer
-6%
Fall
-5%
Annual
-4%
Table 2.3: Recent changes in statewide annual and seasonal precipitation, as calculated
by the difference between the 1950-2000 average and the 2001-2022 average.
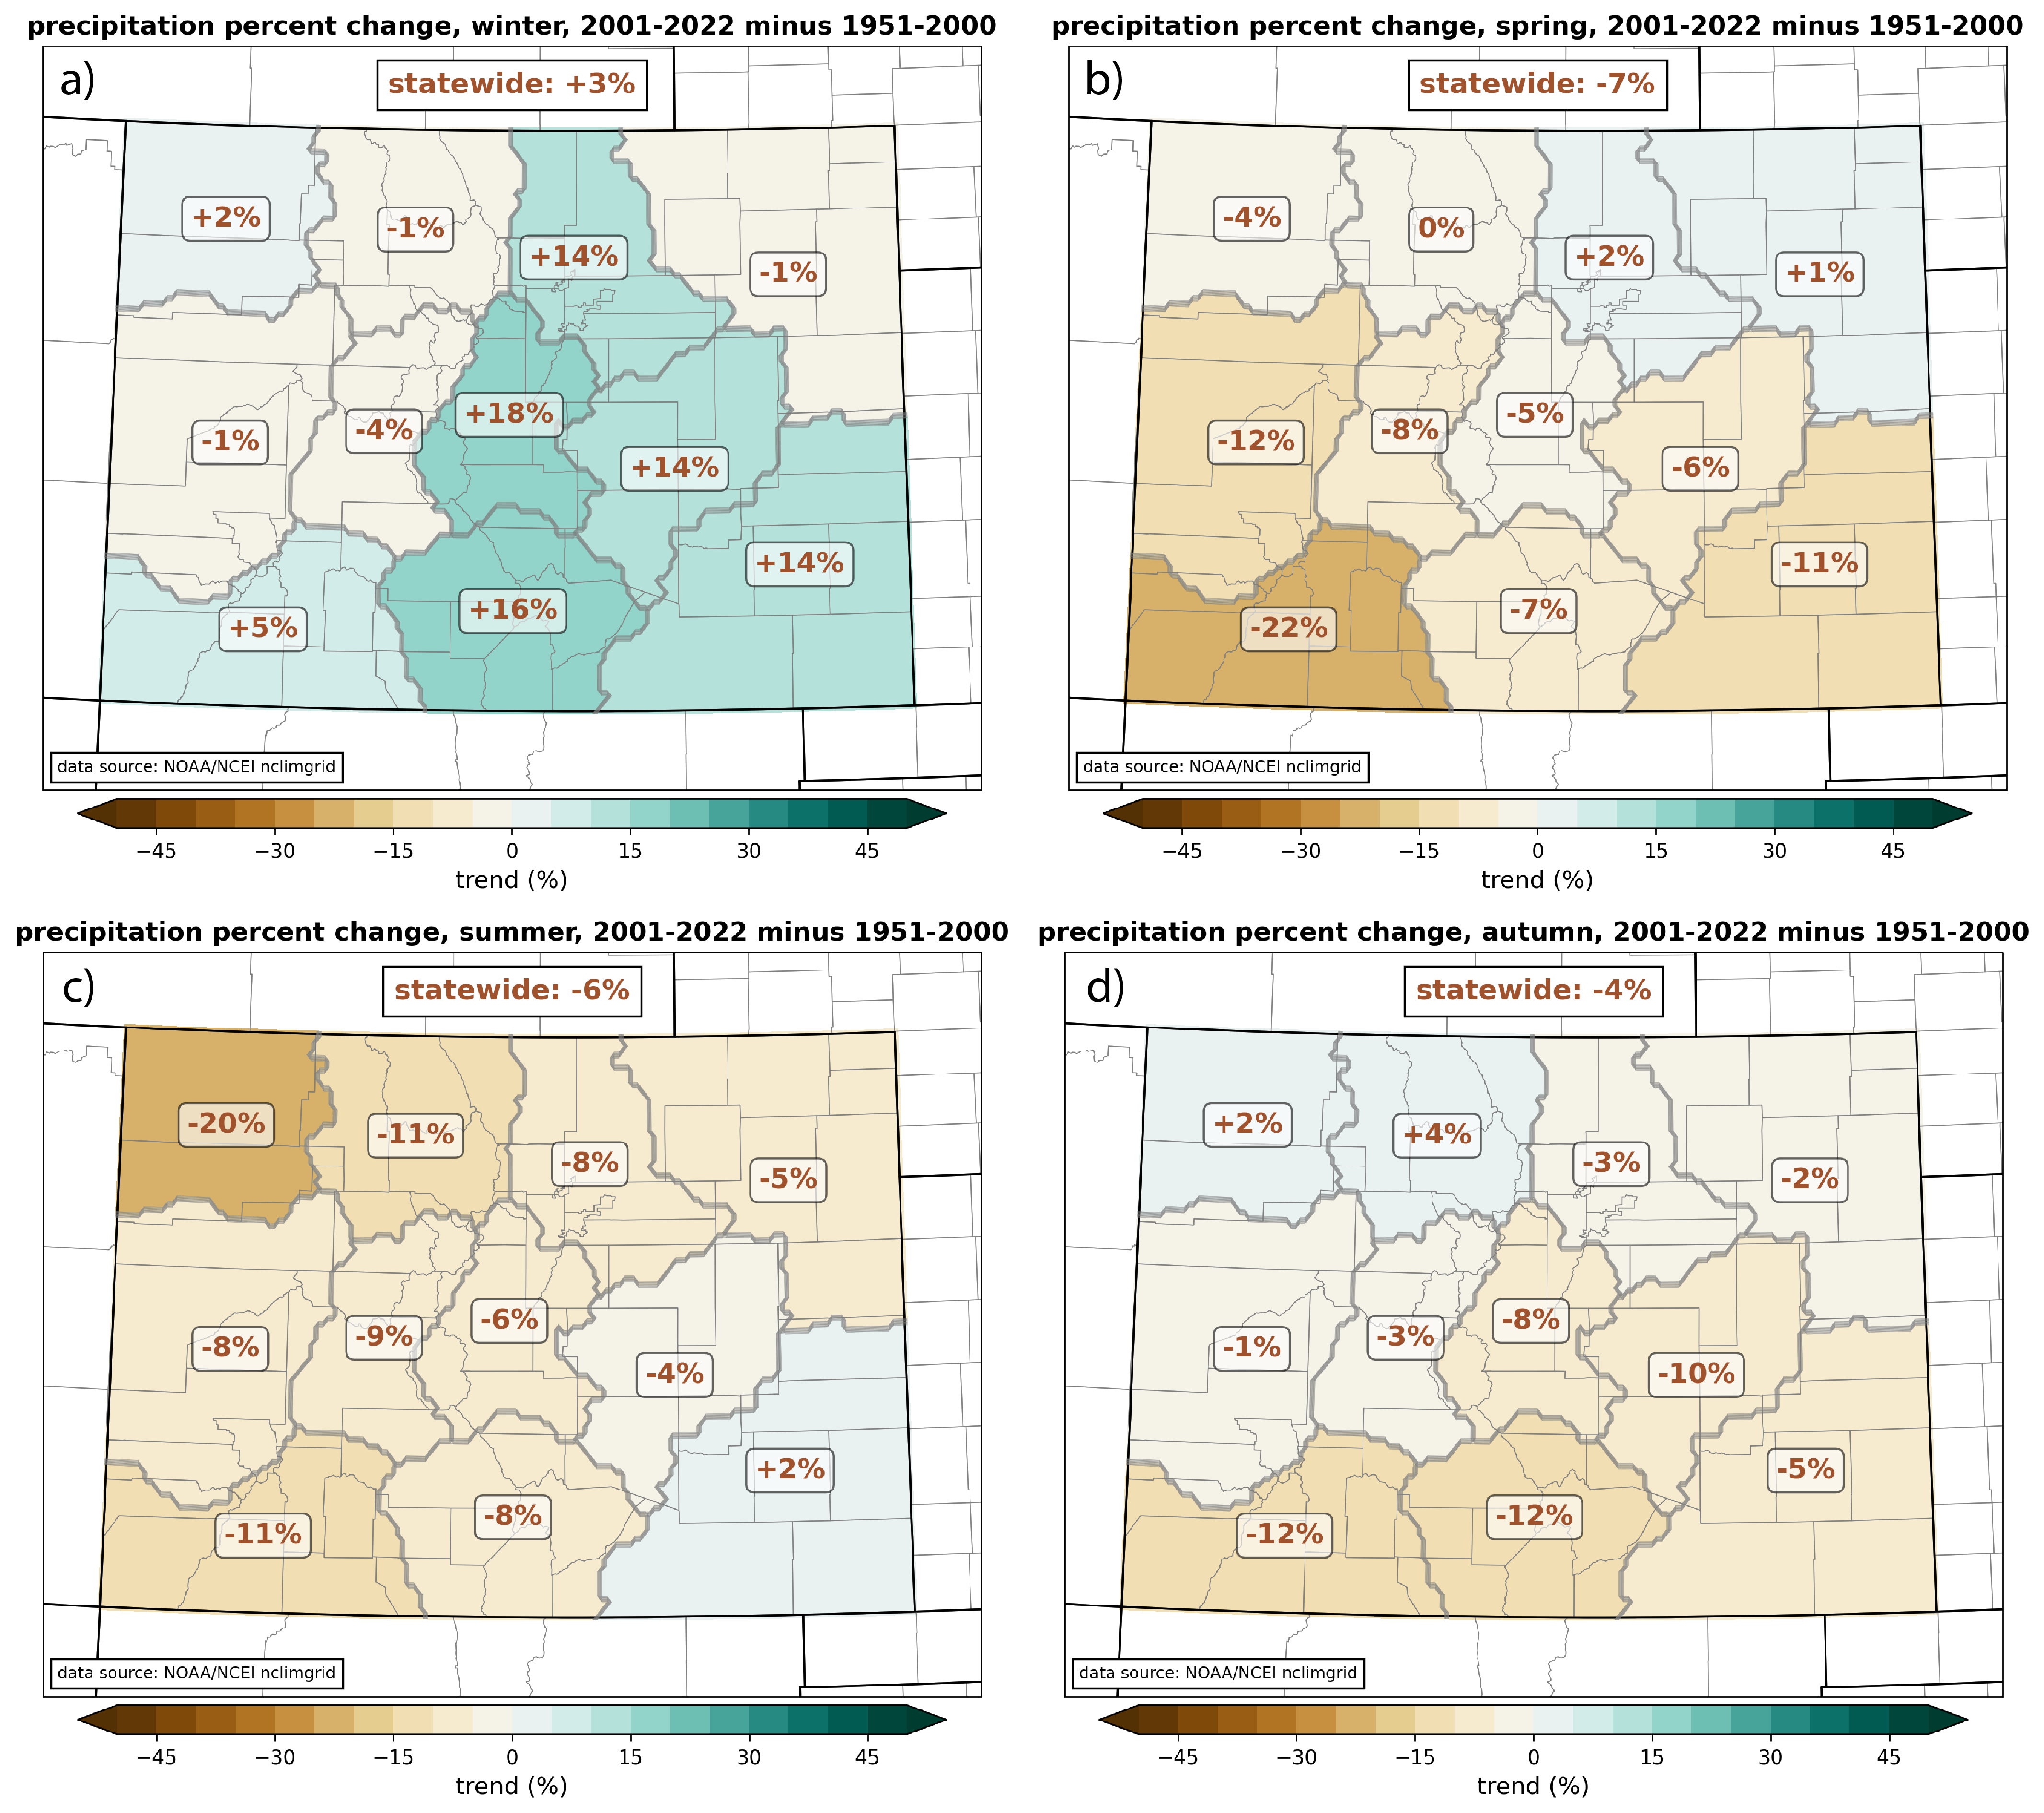
Dry conditions since 2000 have been particularly notable in western Colorado, with the
Southwest division having precipitation decreases of 22%, 11%, and 12% in spring, summer,
and fall, respectively (Fig. 2.11b, 2.11c, 2.11d). In contrast, winter precipitation
increased over this period, but the increase was largely observed in lower-elevation
regions of Colorado, where winter is typically the driest part of the year, thus the
seasonal change had less impact on annual precipitation (Fig. 2.11a). The higher
elevations saw relatively small changes in winter precipitation over this period.
Figure 2.11
Percent change in precipitation between the periods 1951-2000 and 2001-2022, for (a)
winter, December- January-February, (b) spring, March-April-May, (c) summer, June-July-
August, and (d) fall, September-October-November (d).
Colorado’s precipitation variability is partially modulated by the El Niño-Southern
Oscillation (ENSO). ENSO is an episodic interaction that occurs between the tropical
Pacific Ocean and the atmosphere, which results in the occurrence of three different
phases (recurring every 2 to 7 years): El Niño (warmer ocean temperatures in the tropical
Pacific), La Niña (cooler ocean temperatures), and neutral (when there is neither an El
Niño or La Niña). Variability in ENSO
strongly influences global weather patterns.
Coastal areas of the U.S. tend to have the strongest correlations with ENSO variability.
The general pattern in the western U.S. is that wetter conditions are favored in the
Southwest during an El Niño and wetter conditions are favored in the Northwest during a
La Niña. With Colorado on the eastern edge of these areas (far from the ocean), and
bisecting the two regions latitudinally, the state’s relationship with ENSO is more complex.
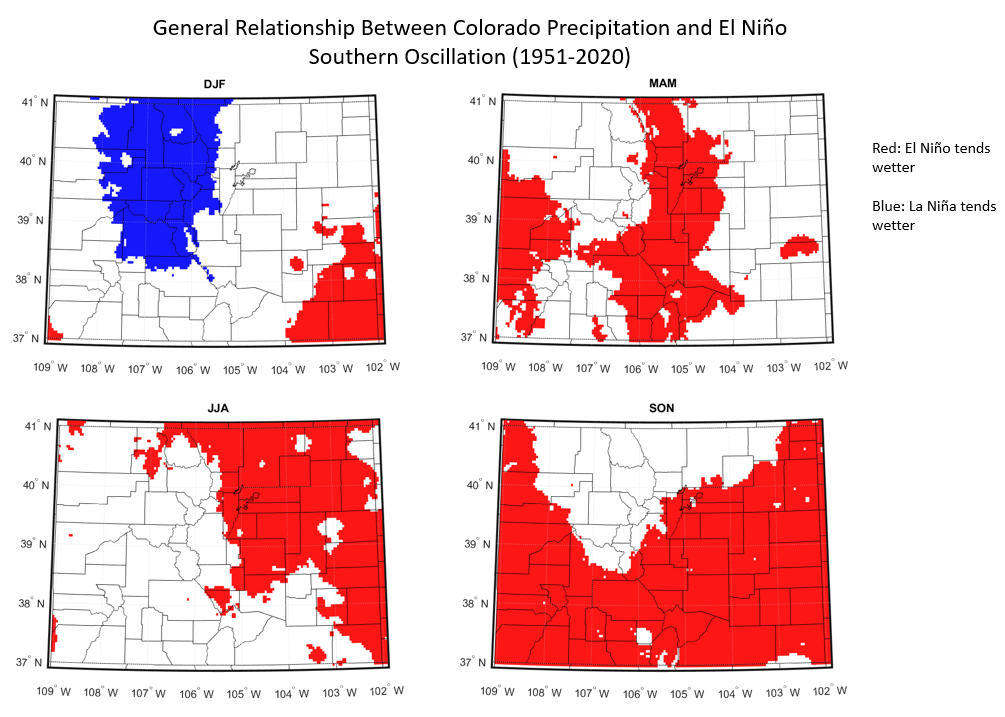
La Niña winters tend to be wetter for our northern and central mountains (Fig. 2.12,
DJF panel). Aside from that signal, La Niña is generally associated with drier conditions
around the state. El Niño favors wetter conditions along the Front Range and west slope
in the spring, in northeast Colorado in the summer, and over large portions of the state
in the fall (Fig. 2.12). While the relationship between Colorado precipitation and ENSO
does exist, ENSO only accounts for a small percentage of precipitation variability. While
ENSO forecasts can be used as a guide for more or less favorable precipitation patterns
around the state, its year-to-year predictive potential is limited.
Figure 2.12
General relationship between El Niño Southern Oscillation and Colorado seasonal
precipitation. Areas of correlation are shaded red when El Niño tends to be wetter and
blue if La Niña tends to be wetter.
El Niño conditions occurred more frequently in the 1980s and 1990s, while La Niña
conditions have been much more common since the turn of the century. Colorado’s climate
connection with ENSO, and its relative frequencies over the last 40-50 years, may have
partially contributed to the persistent dry conditions observed over most of the state
since 1980.
Future precipitation projections
The future direction of precipitation change in Colorado is much less certain than for
temperature change. The climate models lack consensus about whether Colorado will on
average see less, more, or about the same annual precipitation in the future, reflecting
potentially offsetting physical mechanisms, as well as the greater complexity of the
physical processes controlling precipitation compared to temperature. The climate
models—CMIP3, CMIP5, and CMIP6—consistently project is the northernmost U.S. states and
Canada will see overall higher annual precipitation in the future, and that the far
Southwest and Mexico will see lower annual precipitation in the future. Colorado is in a
transition zone between these regions of greater model consensus; this has opposing
implications for the northern (more likely wetter) and southern (more likely drier)
portions of Colorado, as will be explored in the next section, on downscaled projections
of future precipitation.
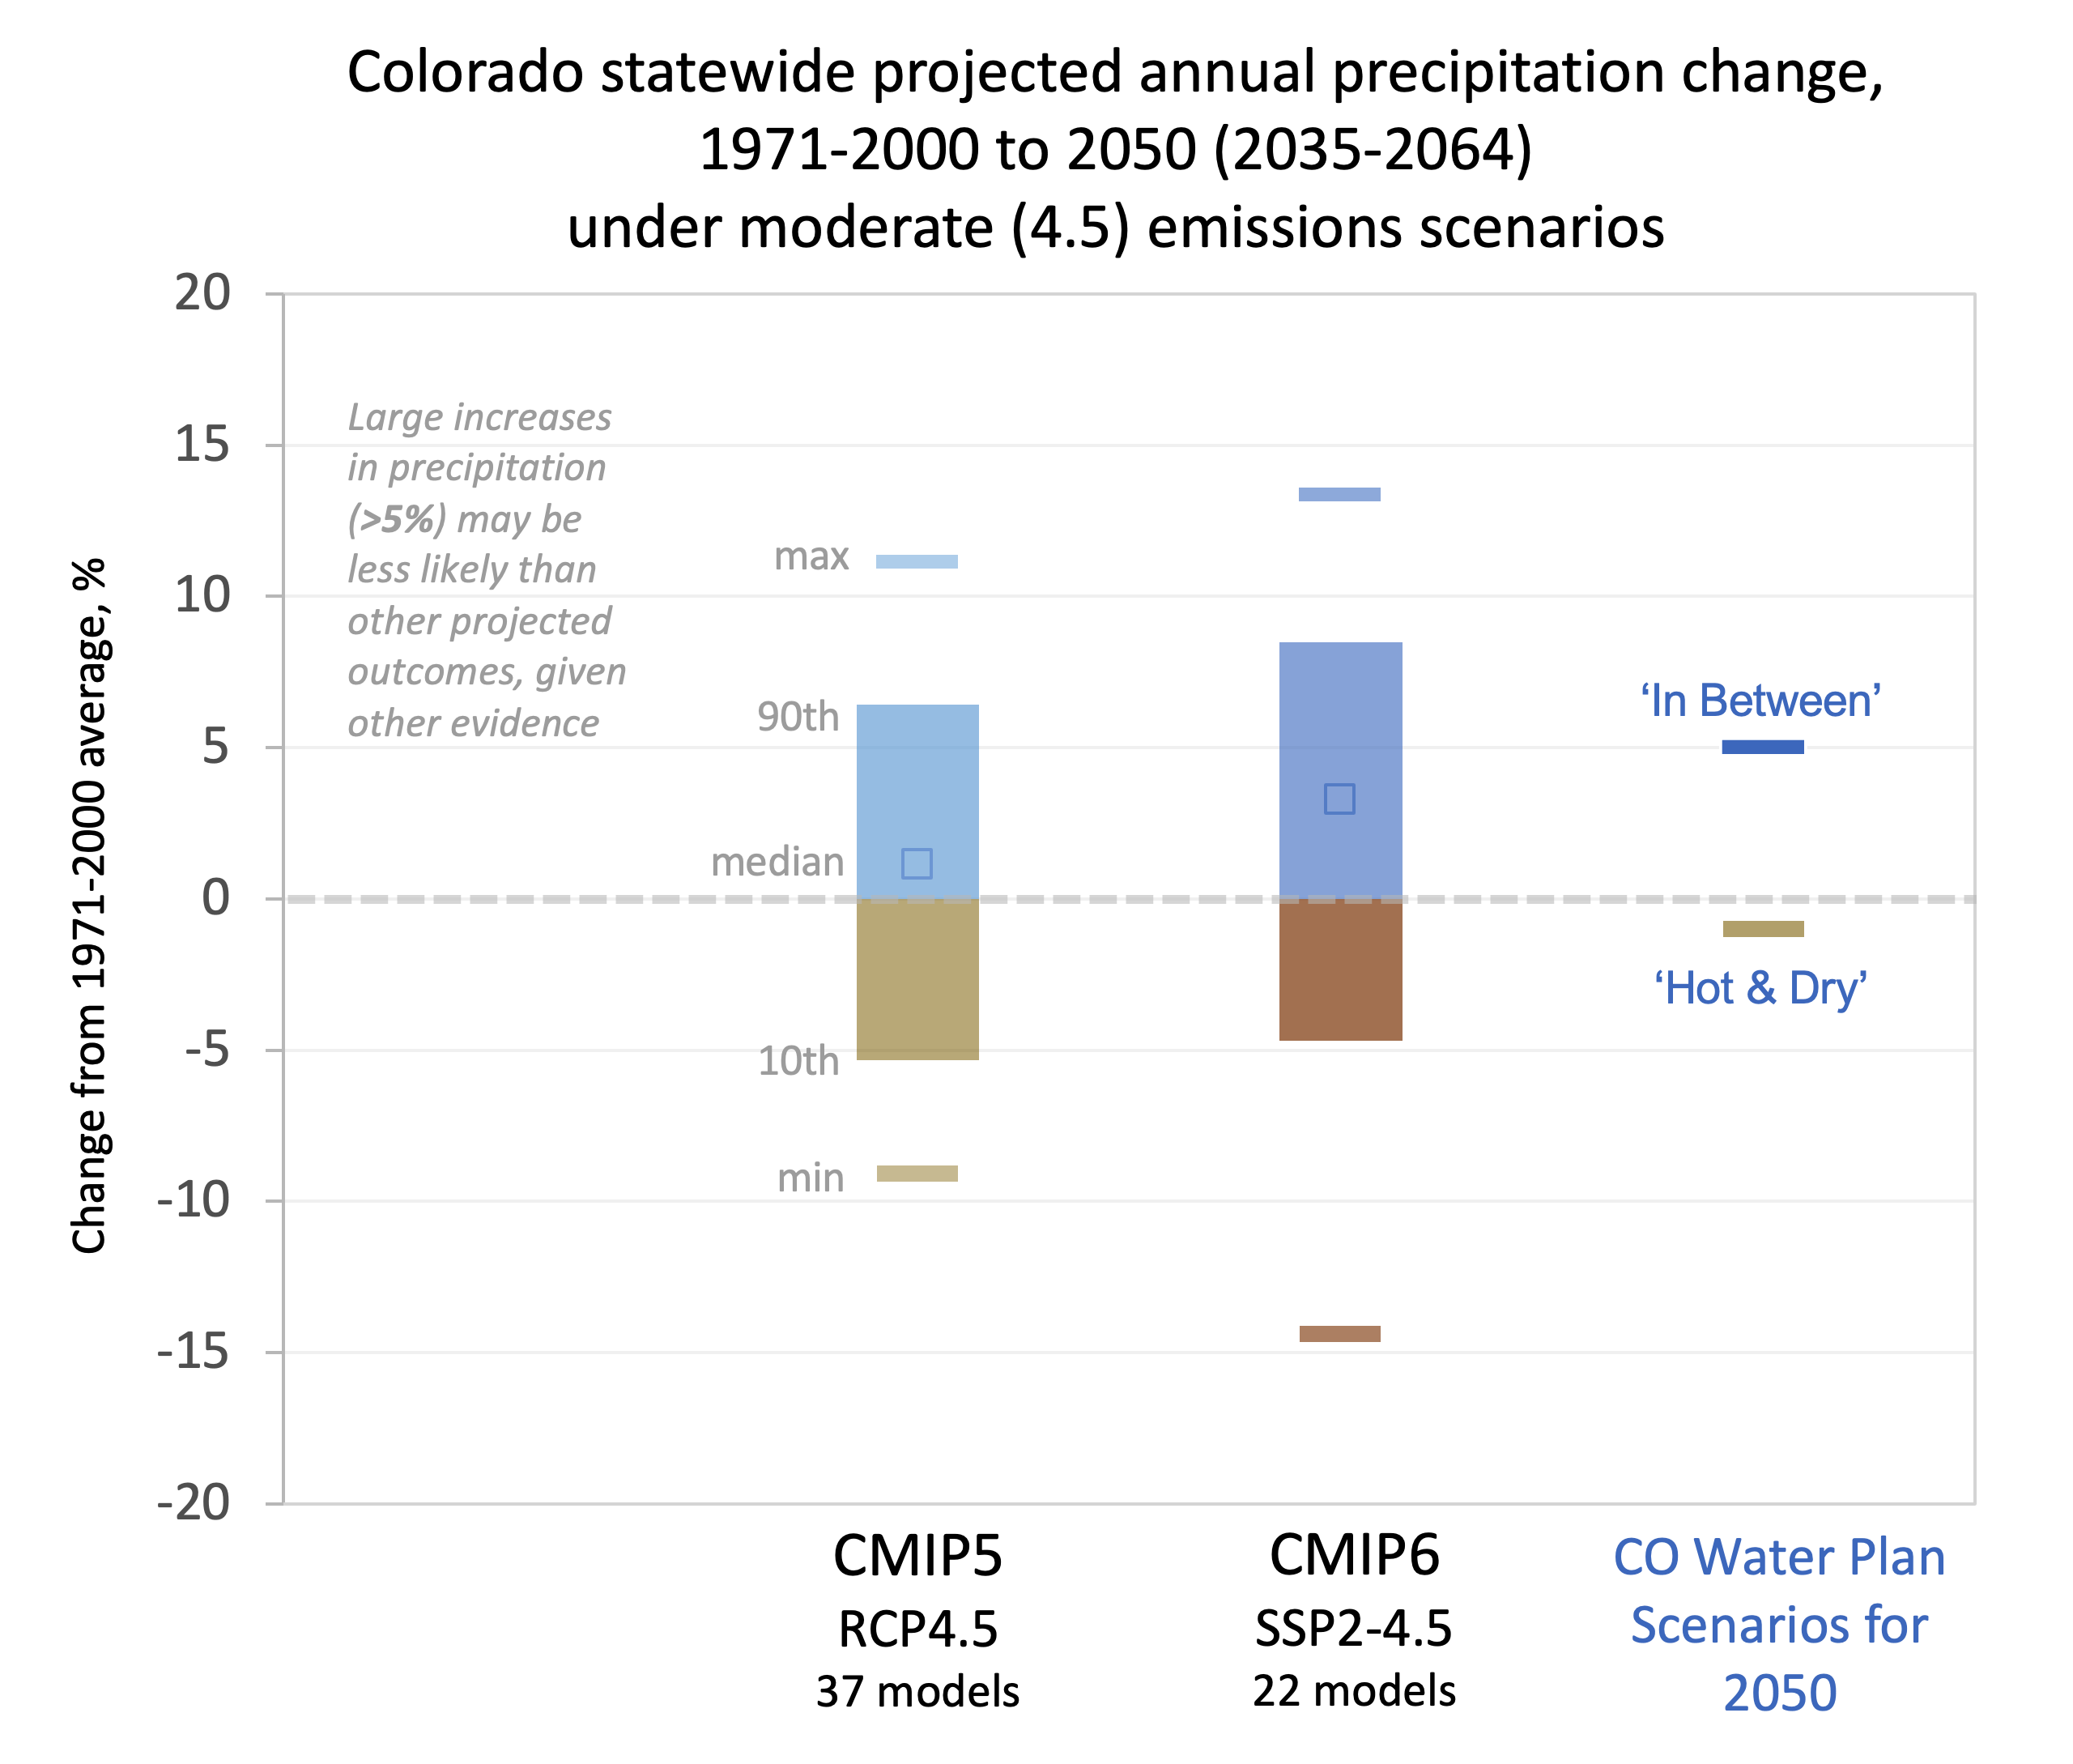
Figure 2.13 illustrates the projected changes in statewide annual precipitation for
Colorado from CMIP5 and CMIP6 models straddle the no-change line under a medium-low
emissions scenario, with some projections showing wetter conditions for 2050 (2035-2064)
and some showing drier conditions for 2050. The two blue bars on the right side of
Figure 2.13 show that the climate change scenarios for precipitation in 2050 used in the
Colorado Water Plan (CWCB 2015, CWCB 2023)
are within the range of both CMIP5 and CMIP6
under 4.5 emissions scenarios, although the “Hot & Dry” scenario is not as dry as many
of the projected precipitation outcomes. Note that even the 90th percentile (+6%) and
10th percentile (-5%) changes shown by the models are much smaller than the observed
year-to-year variability in statewide precipitation (+30% to – 40%), although these
changes are similar to the largest observed deviations in running 30-year averages in
precipitation.
Figure 2.13
Projected future change in average annual precipitation for Colorado statewide for a
2050-centered period (2035-2064) relative to 1971-2000, from the CMIP5 and CMIP6 climate
models under medium-low emissions scenarios. The solid blue and brown bars show the
middle 80% of the model projections (10th-90th percentiles); the two dashes show the
minimum and maximum projections; the open squares show the median projections.
Most CMIP5 projections also show increases in year-to-year and decadal variability in
annual precipitation for Colorado and the interior West over the next several decades
(Lukas et al. 2014;
Pendergrass et al. 2017).
This suggests more frequent occurrences
of both very dry and very wet years, and multi-year periods, than seen in the historical
record. It also suggests more frequent oscillations from one extreme to the other, such
as from 2018 to 2019.
With each model generation since CMIP3, there has been a slight shift towards wetter
outcomes. However, the range of projected changes (i.e., model uncertainty) has not
shrunk from CMIP5 to CMIP6. For a 2070-centered period, the CMIP5 models show the range
of precipitation outcomes shifted slightly wetter than for 2050.
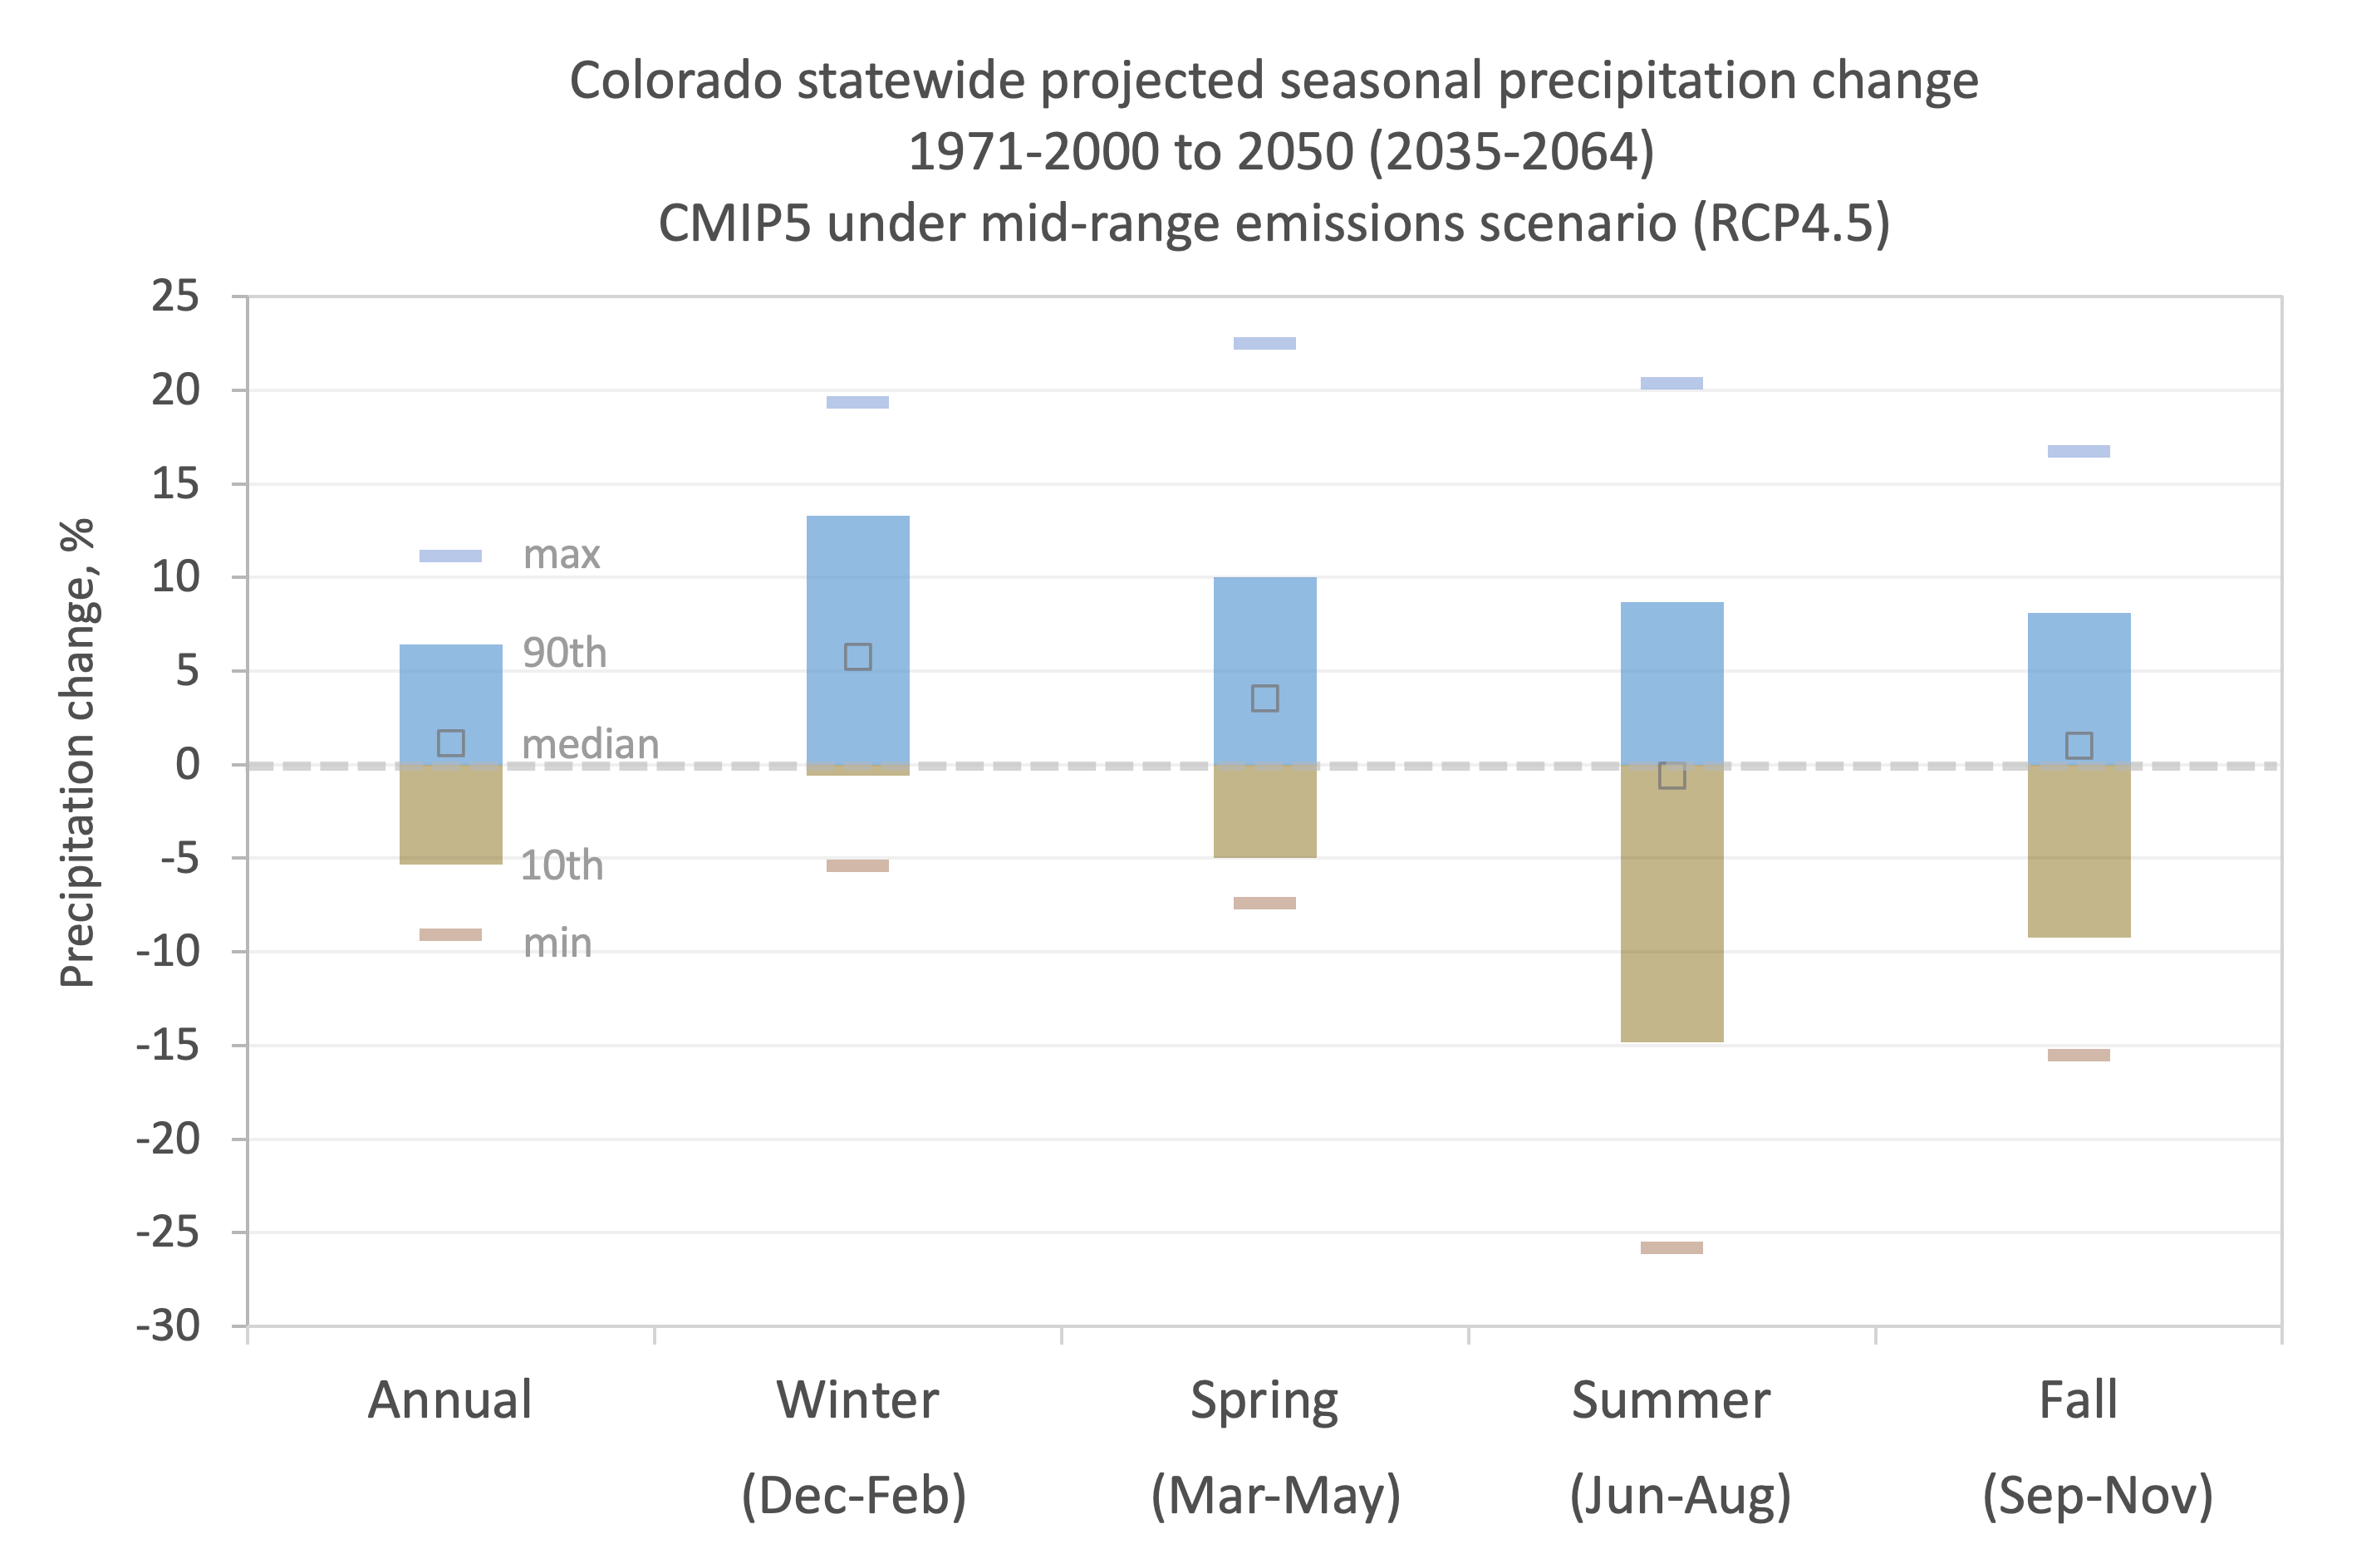
Figure 2.14 shows the seasonal precipitation changes projected by CMIP5 models under
RCP4.5 for a 2050-centered period, using the same dataset shown in Figures 2.13. The
slight overall model signal towards increased annual precipitation (far left) is strongly
accentuated for winter (Dec-Feb) precipitation and to a lesser degree for spring
(Mar-May) precipitation. Summer (Jun-Aug) precipitation shows the largest range and
uncertainty across the models, with the greatest tendency towards large decreases among
the seasons. The projections for fall (Sep-Nov) precipitation are very similar to
annual, with a slight tendency towards increased precipitation. The CMIP6 models show
outcomes for seasonal precipitation that are very similar to CMIP5.
Figure 2.14
Projected future change in seasonal precipitation for Colorado statewide for a
2050-centered period (2035-2064) relative to 1971-2000, from CMIP5 (36 models/projections)
under a medium-low emissions scenario (RCP4.5). The solid blue and brown bars show the
middle 80% of the model projections (10th-90th percentiles); the two dashes show the
minimum and maximum projections; the open squares show the median projections.
The climate models disagree about the direction of change in future precipitation for
Colorado in part because they disagree about how much the average storm track in the
fall, winter, and spring over the western U.S. will shift northward. This northward
shift has been observed already and is expected to continue, as a consequence of
warming-induced expansion of the dry subtropical high-pressure zone that dominates the
climate in the region south of Colorado (Harvey et al. 2020;
McAfee et al. 2011). At the
same time, individual storms that affect Colorado will tend to be wetter, as a warmer
atmosphere holds more moisture (Seager et al. 2010);
the implications of this
relationship for extreme precipitation will be explored in Chapter 4.
A second key factor leading to model disagreement regarding precipitation change is how
ENSO will change in a much warmer climate. Some CMIP5 and CMIP6 models show more frequent
and intense El Niño events (on average associated with wetter conditions for Colorado),
while others show more frequent and intense La Niña events (associated with drier
conditions). None of the CMIP5 and CMIP6 model simulations capture the recent observed
sea-surface temperature (SST) trends in the tropical Pacific, which show a systematic
shift towards a more La Niña-like SST gradient from east to west. It is not clear if
this shift is associated with anthropogenic influences on the climate system (Seager et
al. 2019; Heede et al. 2020;
Lee et al. 2022)
or natural (internal) variability
(Zhang et al. 2021) .
If this observed trend towards a more La Niña-like tropical Pacific
is in fact anthropogenically forced, then drier precipitation outcomes for Colorado would
be more likely to occur over the next several decades.
As described earlier in Chapter 2, observed annual precipitation for Colorado from 2000
through 2022 was about 4% lower than the second half of the 20th century (1951-2000).
While several studies suggest that this recent period of reduced precipitation across the
southwest U.S. is likely due to natural variability (Barnett et al. 2008;
Hoerling et al. 2010; Lehner et al. 2018),
other analyses suggest that there is a long-term
anthropogenic trend towards lower precipitation in the southwest U.S., including
Colorado—though this effect is small enough to be overwhelmed by natural variability on
decadal timescales (Gao et al. 2011;
Hoerling et al. 2019).
If any anthropogenic decrease in Colorado’s average annual precipitation does occur over
the rest of the 21st century, as a large minority of the projections indicate, that would
substantially worsen the impacts of warming temperatures on future hydrology. Conversely,
only a relatively large increase in statewide annual precipitation (>5%) would ameliorate
the impacts of future warming. That outcome, while not off the table, cannot be counted on.
Again, note that the climate models simulate the natural (internal) variability in
precipitation as well as the anthropogenic (forced) change signal. Each projection from
one climate model simulates a unique sequence of variability (e.g., ENSO events), not
synchronized with other models. Even when using a 30-year averaging period (e.g.,
2035-2064) for calculation of future change, some long-term variability is picked up in
the future “change” for a given model projection. This is consistent with how the real
future climate will evolve: there will still be variability in precipitation (whose
characteristics may change), which will potentially be superimposed on a forced trend in
precipitation.
Downscaled (regional) projections of precipitation
For a closer look at how the projected future precipitation changes may vary in different
regions of Colorado, we analyzed the CMIP5-LOCA downscaled climate projection dataset,
as described under Temperature (section 2.2, above).
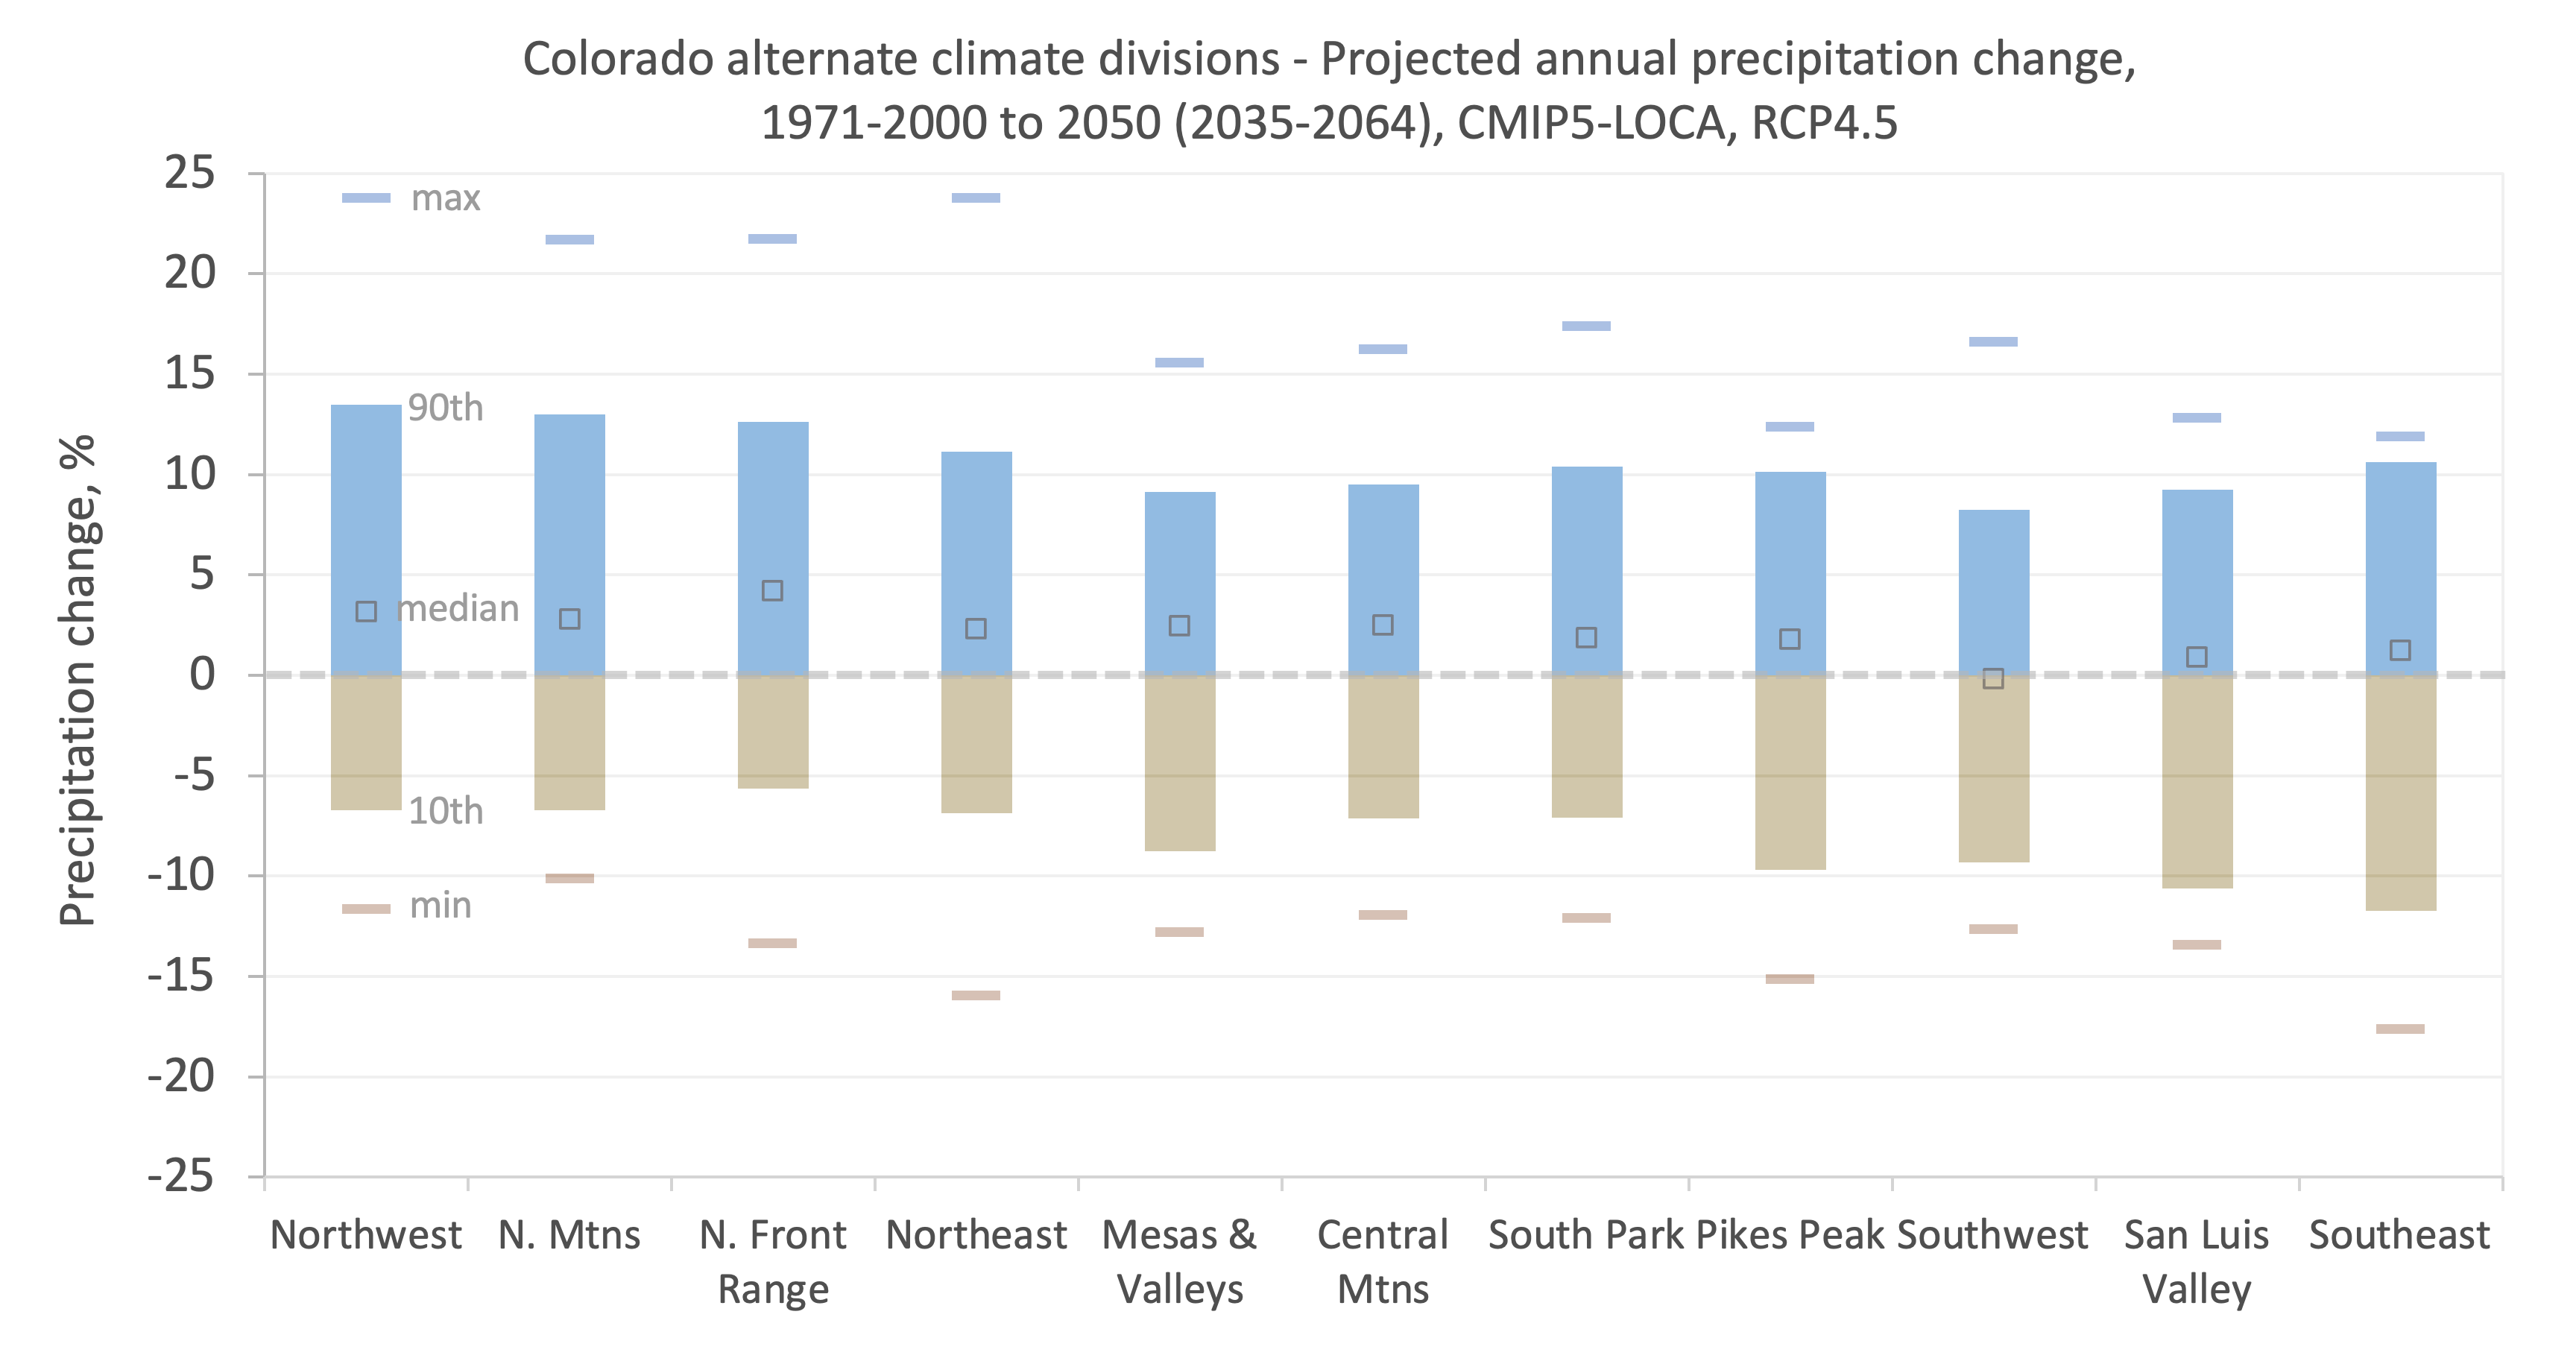
Figure 2.15 shows the projected change in annual precipitation, under RCP4.5, between the
historical baseline (1971-2000) and the 2050-centered future period (2035-2064) for the
11 alternative Colorado climate divisions. In each division, the downscaled model
projections do not agree on the direction of future precipitation change, with the
range of projections extending from large increases to large decreases, as with the
statewide projections (Figure 2.15). But in general, the ranges of projections for the
northern divisions (Northwest, N. Mtns, N. Front Range, Northeast) are shifted towards
wetter outcomes than for the southern divisions (Southwest, San Luis Valley, Southeast).
Whatever the overall future change in annual precipitation for Colorado as a whole--more,
less, or about the same--the southern divisions are likely to have a drier outcome than
the rest of the state, especially the northern divisions.
Figure 2.15
Projected future change in annual precipitation in 11 alternative Colorado climate
divisions for a 2050- centered period (2035-2064) relative to 1971-2000, from an ensemble
of 32 CMIP5-LOCA climate projections under a medium-low emissions scenario (RCP4.5).
The solid blue and brown bars show the middle 80% of the model projections (10th-90th
percentiles); the two dashes show the minimum and maximum projections; the open squares
show the median projections.
Alizadeh, M. R., J. T. Abatzoglou, C. H. Luce, J. F. Adamowski, A. Farid, and M. Sadegh,
2021: Warming enabled upslope advance in western US forest fires.
Proc. Natl. Acad.
Sci. U.S.A., 118, e2009717118, https://doi.org/10.1073/pnas.2009717118.
American Meteorological Society, 2022: Downslope windstorm.
Glossary of Meteorology,
available online at: https://glossary.ametsoc.org/wiki/Downslope_windstorm.
Boustead, B. E. M., S. D. Hilberg, M. D. Shulski, and K. G. Hubbard, 2015: The
Accumulated Winter Season Severity Index (AWSSI). Journal of Applied Meteorology and
Climatology, 54, 1693–1712, https:// doi.org/10.1175/JAMC-D-14-0217.1.
Domeisen, D. I. V., and Coauthors, 2023: Prediction and projection of heatwaves.
Nature Reviews Earth & Environment, 4, 36–50, https://doi.org/10.1038/s43017-022-00371-z.
Gochis, D., and Coauthors, 2015: The Great Colorado Flood of September 2013.
Bulletin of the American Meteorological Society, 96, 1461–1487,
https://doi.org/10.1175/BAMS-D-13-00241.1.
Hirsch, R. M., and K. R. Ryberg, 2012: Has the magnitude of floods across the USA changed with global CO 2 levels? Hydrological Sciences Journal, 57, 1–9, https://doi.org/10.1080/02626667.2011.62 1895.
Hoerling, M., J. Eischeid, J. Perlwitz, X.-W. Quan, K. Wolter, and L. Cheng, 2016: Characterizing Recent Trends in U.S. Heavy Precipitation. Journal of Climate, 29, 2313–2332, https://doi.org/10.1175/ JCLI-D-15-0441.1.
Hoerling, M. P., J. Eischeid, and J. Perlwitz, 2010: Regional precipitation trends: distinguishing natural vari- ability from anthropogenic forcing. Journal of Climate, 23, 2131–2145, https://doi.org/10.1175/ 2009JCLI3420.1.
Hoerling, M. P., J. J. Barsugli, B. Livneh, J. Eischeid, X. Quan, and A. Badger, 2019: Causes for the Century-Long Decline in Colorado River Flow. J. Climate, JCLI-D-19-0207.1, https://doi.org/10.1175/JCLI-D-19-0207.1.
Holden, Z. A., and Coauthors, 2018: Decreasing fire season precipitation increased recent western US for- est wildfire activity. Proc. Natl. Acad. Sci. U.S.A., 115, https://doi.org/10.1073/pnas.1802316115.
Kampf, S. K., D. McGrath, M. G. Sears, S. R. Fassnacht, L. Kiewiet, and J. C.
Hammond, 2022: Increasing wildfire impacts on snowpack in the western U.S.
Proc. Natl. Acad. Sci. U.S.A., 119, e2200333119, https://doi.org/10.1073/pnas.2200333119.
Mankin, J. S., I. R. Simpson, A. hoell, R. Fu, J. Lisonbee, A. Sheffield, and
D. Barrie, 2021: NOAA Drought Task Force Report on the 2020–2021 Southwestern U.S.
Drought. NOAA Drought Task Force, MAPP, NIDIS,
https://www.drought.gov/sites/default/files/2021-09/NOAA-Drought-Task-Force-IV-Southwest-Drought-Report-9-23-21.pdf.
Moritz, M. A., M. A. Parisien, E. Batllori, M. A. Krawchuk, J. Van Dorn, D. J.
Ganz, and K. Hayhoe, 2012: Climate change and disruptions to global
fire activity. Ecosphere, 3, art49, https://doi.org/10.1890/ES11-00345.1.
Mote, P. W., S. Li, D. P. Lettenmaier, M. Xiao, and R. Engel, 2018: Dramatic
declines in snowpack in the western US. npj Climate and Atmospheric Science,
1, https://doi.org/10.1038/s41612-018-0012-1.
NOAA National Centers for Environmental Information, 2023: NOAA Climate
at a Glance. https://www.ncei.noaa.gov/access/monitoring/climate-at-a-glance/statewide/time-series
(Accessed September 7, 2023).
Perkins, S. E., and L. V. Alexander, 2013: On the Measurement of Heat
Waves. Journal of Climate, 26, 4500–4517, https://doi.org/10.1175/JCLI-D-12-00383.1.
Raupach, T. H., and Coauthors, 2021: The effects of climate change on
hailstorms. Nature Reviews Earth & Environment, 2, 213–226,
https://doi.org/10.1038/s43017-020-00133-9.
Reclamation, 2012b: Colorado River Basin water supply and demand
study-Technical Report C. US Bureau of Reclamation,
https://www.usbr.gov/lc/region/programs/crbstudy/finalreport/Technical%20Report%20C%20-%20Water%20Demand%20Assessment/TR-C-Water_Demand_Assessmemt_FINAL.pdf
(Accessed April 26, 2019).
Schumacher, R.S., R.A. Bolinger, and J.J. Lukas, 2024: Development of alternate
climate divisions for Colorado based on gridded data. Submitted to Journal of
Applied and Service Climatology, May 2023.
Schwalm, C. R., S. Glendon, and P. B. Duffy, 2020: RCP8.5 tracks cumulative
CO2 emissions. Proc. Natl. Acad. Sci. U.S.A., 117, 19656–19657,
https://doi.org/10.1073/pnas.2007117117.
Trenberth, K. E., J. T. Fasullo, and T. G. Shepherd, 2015: Attribution of
climate extreme events. Nature Clim Change, 5, 725–730, https://doi.org/10.1038/nclimate2657.