| Climate variable/event | Recent trend | Projected future change | Confidence in change |
|---|---|---|---|
| Heat Waves | More frequent/intense | More frequent/intense | Very high |
| Cold Waves | Fewer | Fewer | Medium |
| Droughts | More frequent/intense | More frequent/intense | High |
| Wildfires | More and larger | More and larger | High |
| Extreme Precipitation | More intense | More frequent/intense | Medium |
| Flooding | Mixed | Higher | Medium |
| Windstorms | Uncertain | Uncertain | Low |
| Severe Thunderstorms | Uncertain | More frequent | Low |
| Hail | Uncertain | More large hail | Low |
| Tornadoes | Uncertain | Uncertain | Low |
| Winter Storms | Uncertain | Larger storms | Low |
| Dust-on-snow | Greater dust levels | Greater dust levels | Medium |
Heat waves and cold waves
This chapter assesses recent trends and likely future changes in climate extremes and climate-driven hazards in Colorado. While it is true that anthropogenic climate change is increasing the overall risk of impacts across the various extreme weather and climate events and natural hazards, both globally and in Colorado, this generalization does not necessarily apply to each type of extreme or hazard. Each type has different climatic drivers, and there may also be non-climatic factors that act to increase (or decrease) their risk and impacts, such as with floods and wildfires.
In general, extremes and natural hazards that have strong physical linkages to warming temperatures are the ones most likely to have already increased and to increase further in the future. At the top of this list are heat waves; droughts and wildfires are also worsened in a warmer climate. All three have shown clear recent upward trends in Colorado. Extreme precipitation also has a direct physical linkage with temperature and is expected to become more frequent and severe with warming, yet this has not been clearly seen in our region. Severe thunderstorms and their related hazards - tornadoes, hail, and winds — have more complex linkages with warming. Due to observational challenges, it is difficult to assess recent trends and future projections for thunderstorm hazards.
In the sections below, for each type of climate extreme or hazard, we describe its drivers, examine recent variability and trends to the extent that observed datasets can support that assessment, highlight recent high-impact events, and then summarize the likelihood of future changes and the evidence for that assessment. This chapter emphasizes the observed and potential future changes of these extremes and hazards, with limited references to the impacts from these events. The update to the Colorado Vulnerability Study will provide greater detail on Colorado’s vulnerabilities, documented impacts, and risk of future impacts to these types of events.
As the climate warms, periods of extreme heat are expected to become more frequent, while periods of extreme cold become less frequent (USGCRP 2017). Two different approaches can be employed to investigate changes in temperature extremes. One is to consider the exceedance of absolute temperature thresholds (e.g., exceeding 95°F or dropping below 0°F). The advantage of this method is that these thresholds are familiar to people, and they generally correspond to some kind of impact (e.g., heat stress to humans and animals increases at higher temperatures). The disadvantage is that, in a state as diverse as Colorado, some areas surpass these thresholds many times per year, whereas other areas may never experience those temperatures. Another method is to consider temperatures that are rare for that location (e.g., a temperature that occurs on average only once per year, or that exceeds a percentile, etc.). Furthermore, when considering heat waves and cold waves, many different definitions have been proposed in the literature (e.g., Perkins and Alexander 2013). Regardless of the specific methods used, available data show that heat waves are generally becoming more frequent, and cold waves less frequent, in Colorado. However, the details of the results vary, as shown below.
Comparing the most recent two decades (2001-2020) to the 1971-2000 period shows that in eastern Colorado and the valleys in western Colorado, the number of hot days (95°F or higher) has increased. Some areas experienced over 10 more hot days per year during the period from 2001-2020 than during the period from 1971-2000 (Fig. 4.1a). Other thresholds such as 90°F show similar spatial patterns; although many areas in Colorado, especially at high elevations, rarely or never reach 90°F.
Very cold nights are becoming less frequent across Colorado but generally at a slower pace than hot days are increasing. Fig. 4.1b shows that the San Luis Valley has experienced the greatest reduction in sub-zero temperatures, by a few days per year. Most other parts of the state have relatively small reductions of 1-2 nights per year, whereas a few pockets in Gunnison, Fremont, and Rio Blanco Counties have seen small increases in the frequency of sub-zero temperatures. In some areas of southeastern Colorado, temperatures below zero are very rare.
Calculations at individual stations (not shown) are generally consistent with the findings from the gridded dataset used in Fig. 4.1. However, this gridded dataset only has daily data available back to 1951, and long-term stations in southeastern Colorado show that the dust bowl era in the 1930s had more frequent occurrence of extreme heat than even the first two decades of the 2000s. Nonetheless, recent trends in this part of the state are toward more frequent hot days.
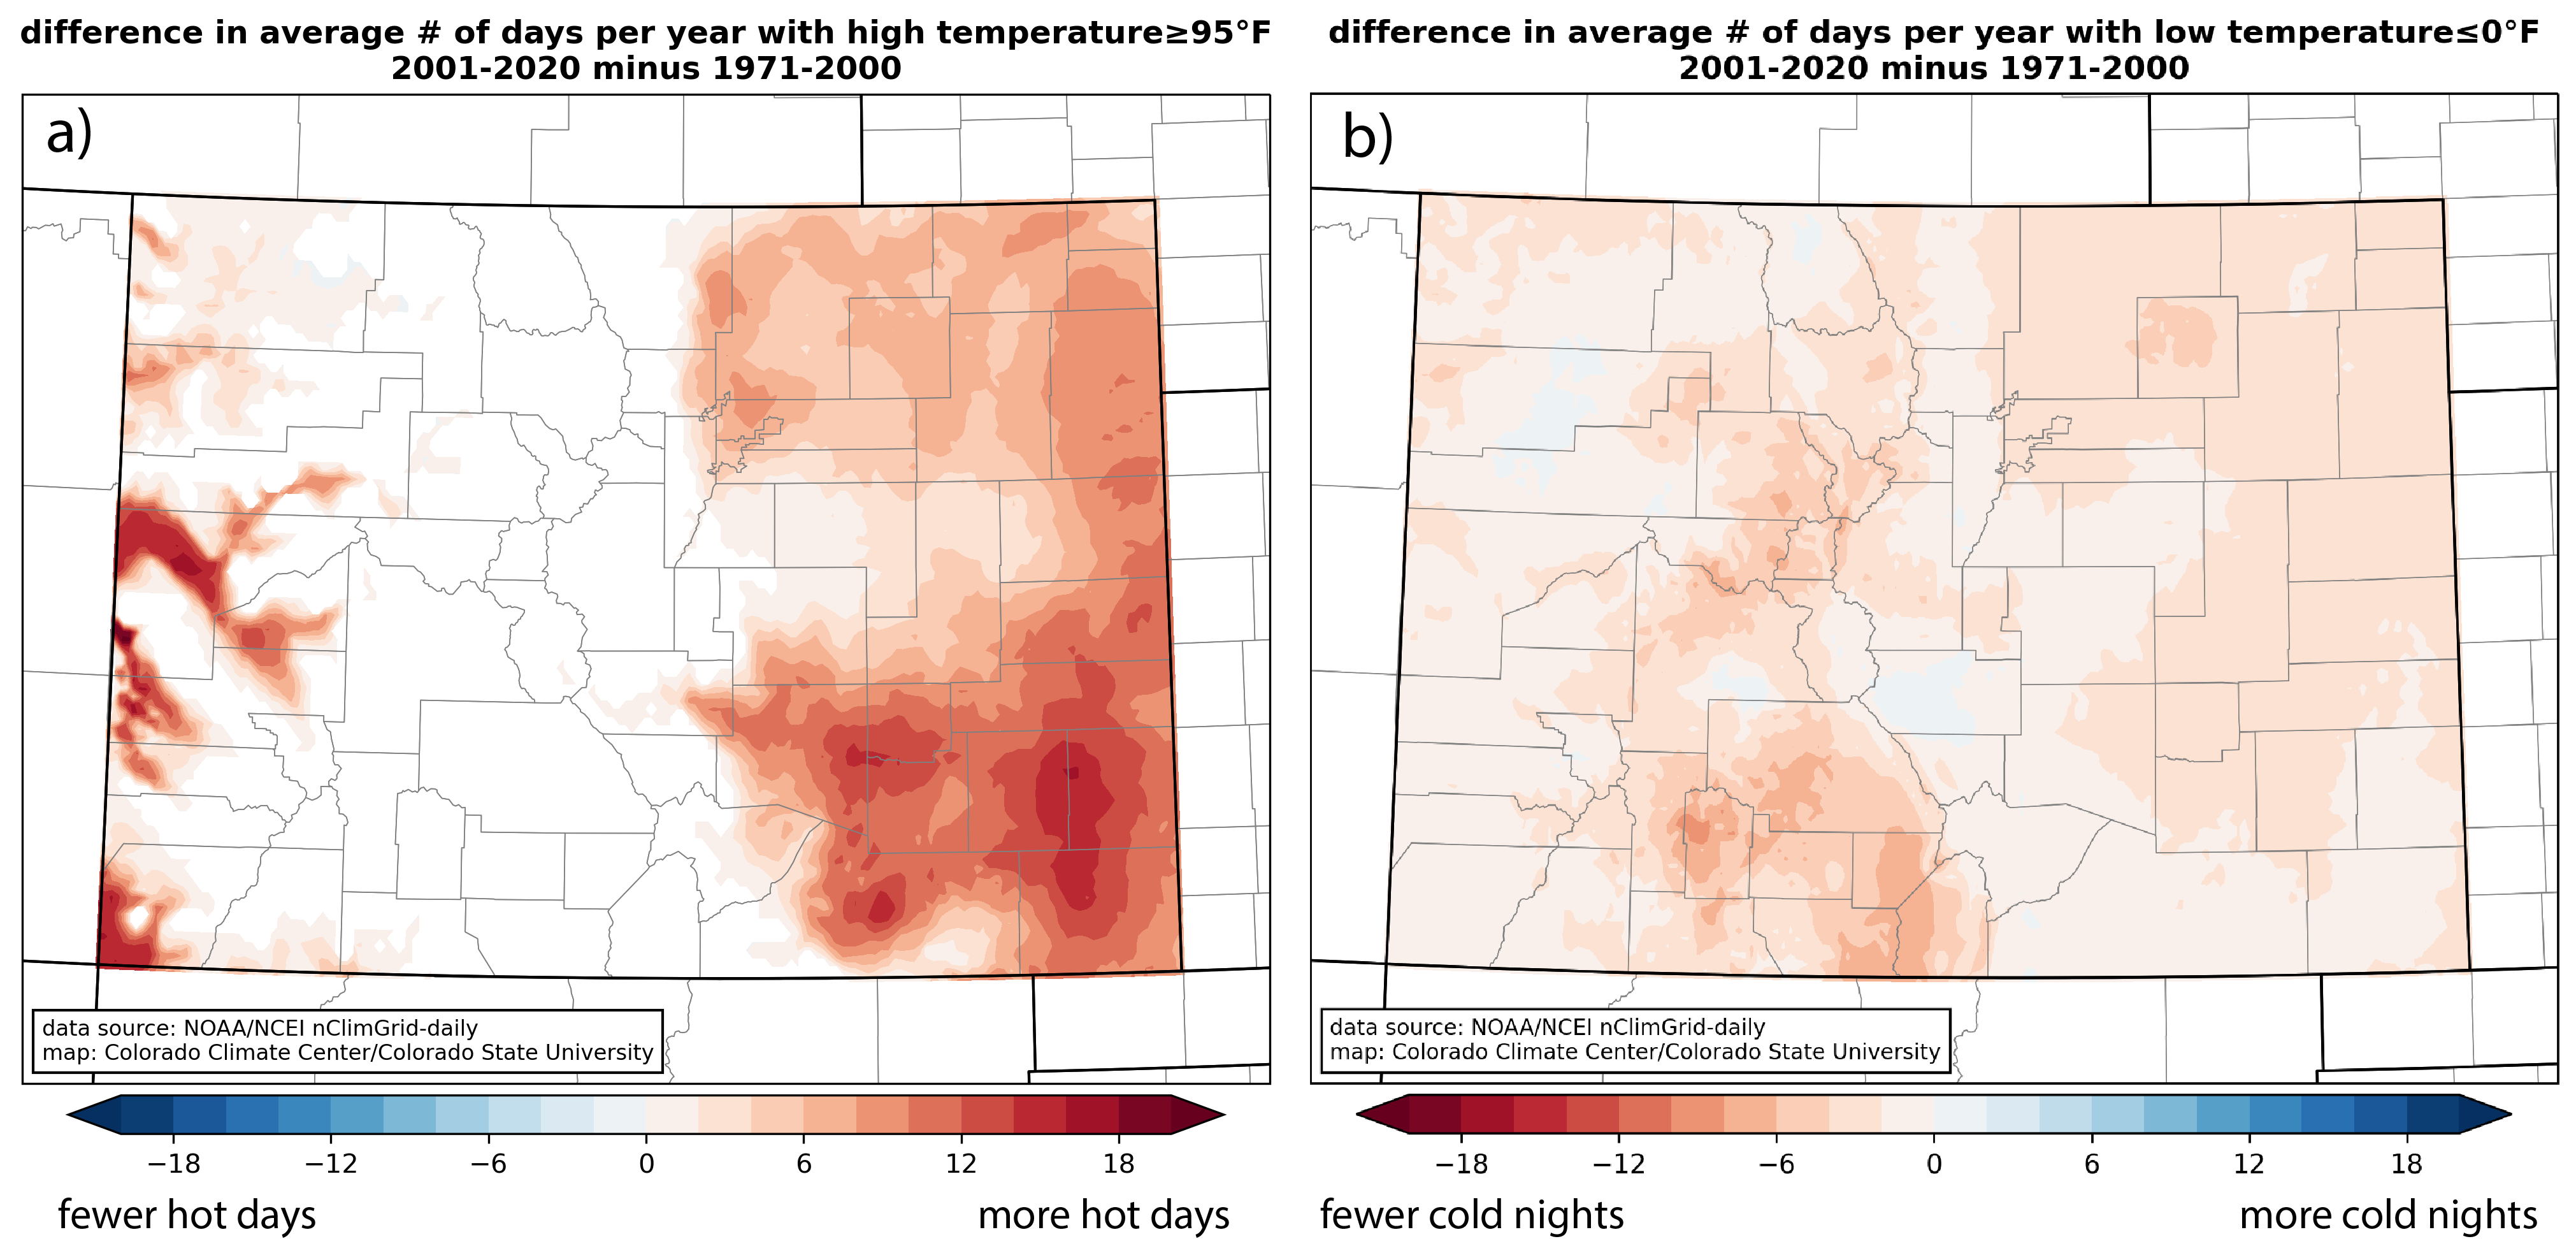
Figure 4.1
Differences in the number of days per year with (a) daily maximum temperature ≥ 95°F, and (b) daily minimum temperature ≤ 0°F, comparing the period 2001-2020 to 1971-2000.
In contrast to the absolute temperature thresholds presented above, heat waves and cold waves are generally defined relative to the historical temperature ranges for an area. Some studies consider heat/cold waves as consecutive days exceeding a threshold (Perkins and Alexander 2013; Keellings and Moradkhani 2020; Domeisen et al. 2023), whereas others consider the average temperature over a period of days (Peterson et al. 2013). Here, we will use a definition for heat and cold waves that is similar to Peterson et al. (2013). Specifically, a heat wave or cold wave is defined using a 4-day averaged daily mean temperature (daily mean is the average of the high and low for the day). The 4-day average temperature that was exceeded on average once per year during 1971-2000 was defined as a heat or cold wave (in other words, the average hottest or coldest 4-day period per year during 1971-2000). This calculation is done for each alternate climate division, and then the number of heat/cold waves in each year and decade over the full dataset (1951-2022) were calculated. Other definitions of heat/cold waves, including different lengths and requiring consecutive days exceeding a threshold, showed qualitatively similar results. The benefits of this calculation are 1) it includes both maximum and minimum temperature in the analysis, 2) the four-day average indicates a sustained period of hot or cold (thus a “wave”), and 3) the extreme threshold is uniquely defined for each climate division.
Heat waves have increased in frequency from the 1950s to present in all climate divisions (Fig. 4.2), though the upward trend is statistically significant in only 8 of the 11 divisions. In particular, the decades of the 2000s and 2010s had substantially more heat waves than the preceding decades in nearly all divisions. The increases are especially large in the Northwest and Mesas & Valleys divisions, where very few heat waves occurred in the 1950s and 60s, and then 2-3 per year occurred on average in the 2000s and 2010s. The increase in heat waves has been less prominent in the Northeast and Southeast divisions (Fig. 4.2), despite the total number of hot days increasing (Fig. 4.1a).
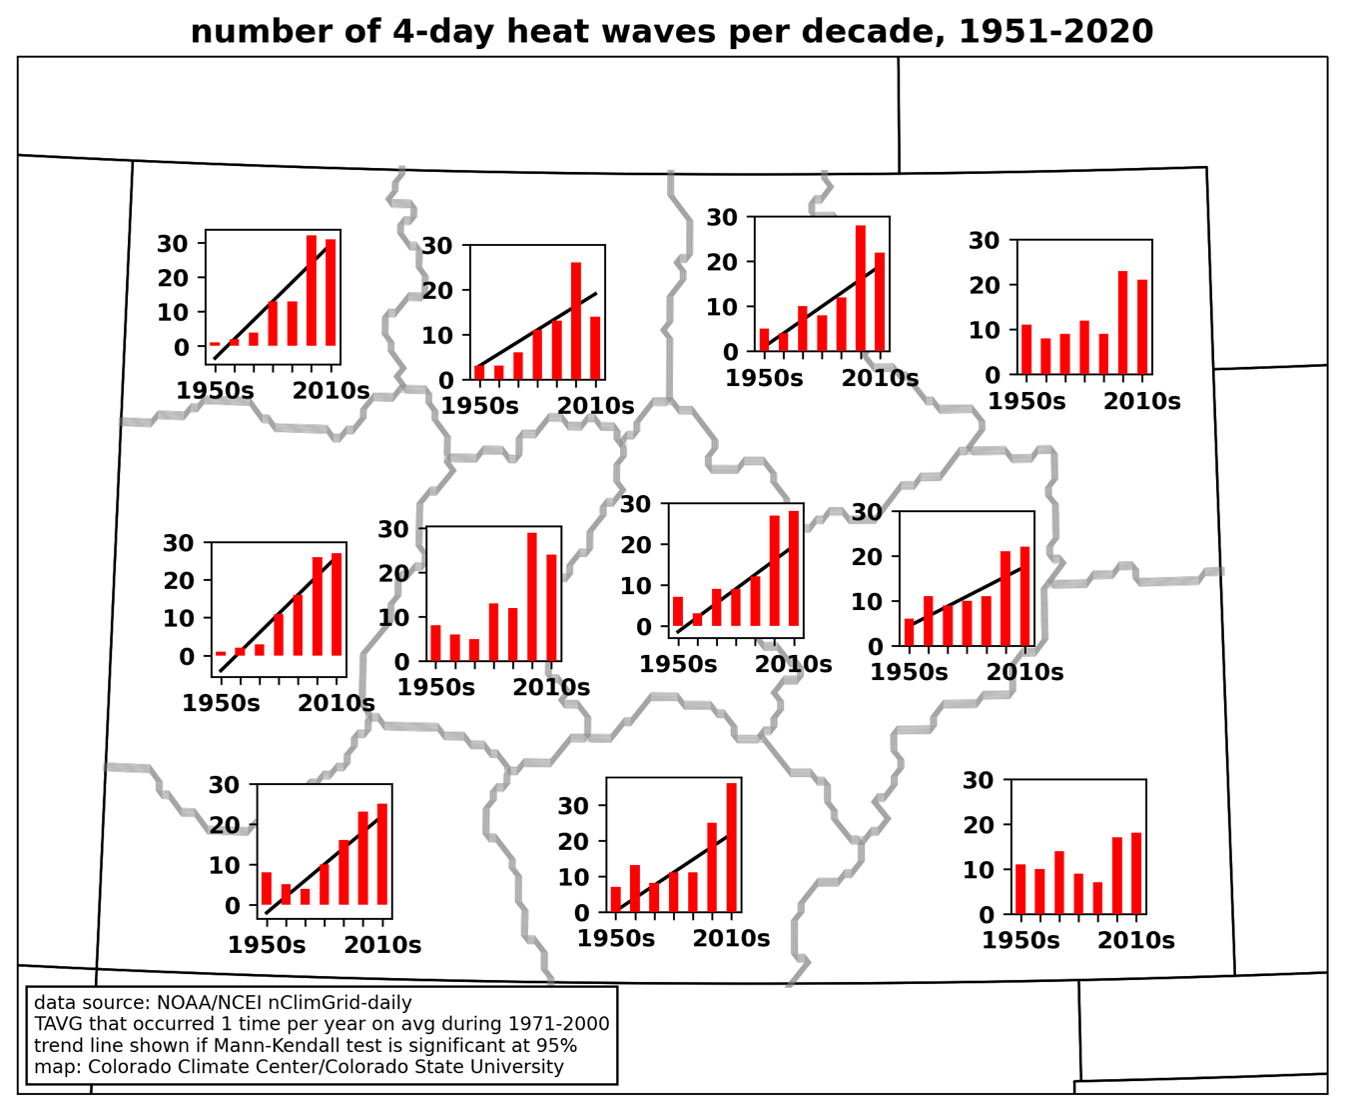
Figure 4.2
Time series of the number of 4-day heat waves per decade from 1951-2020 for each climate division. (See Fig. 2.2 for the names of the divisions.) Heat waves are defined as a 4-day period in which the daily mean temperature (the sum of the daily maximum and minimum temperatures divided by two), averaged over the four days, exceeds the 4-day average temperature that was exceeded on average once per year during 1971-2000.
Data for 2021-22 (not included in the decadal analysis above) revealed a large number of heat waves in all parts of the state; in some divisions, there were more heat waves in the first two years of the 2020s than in some entire decades in the 20th century.
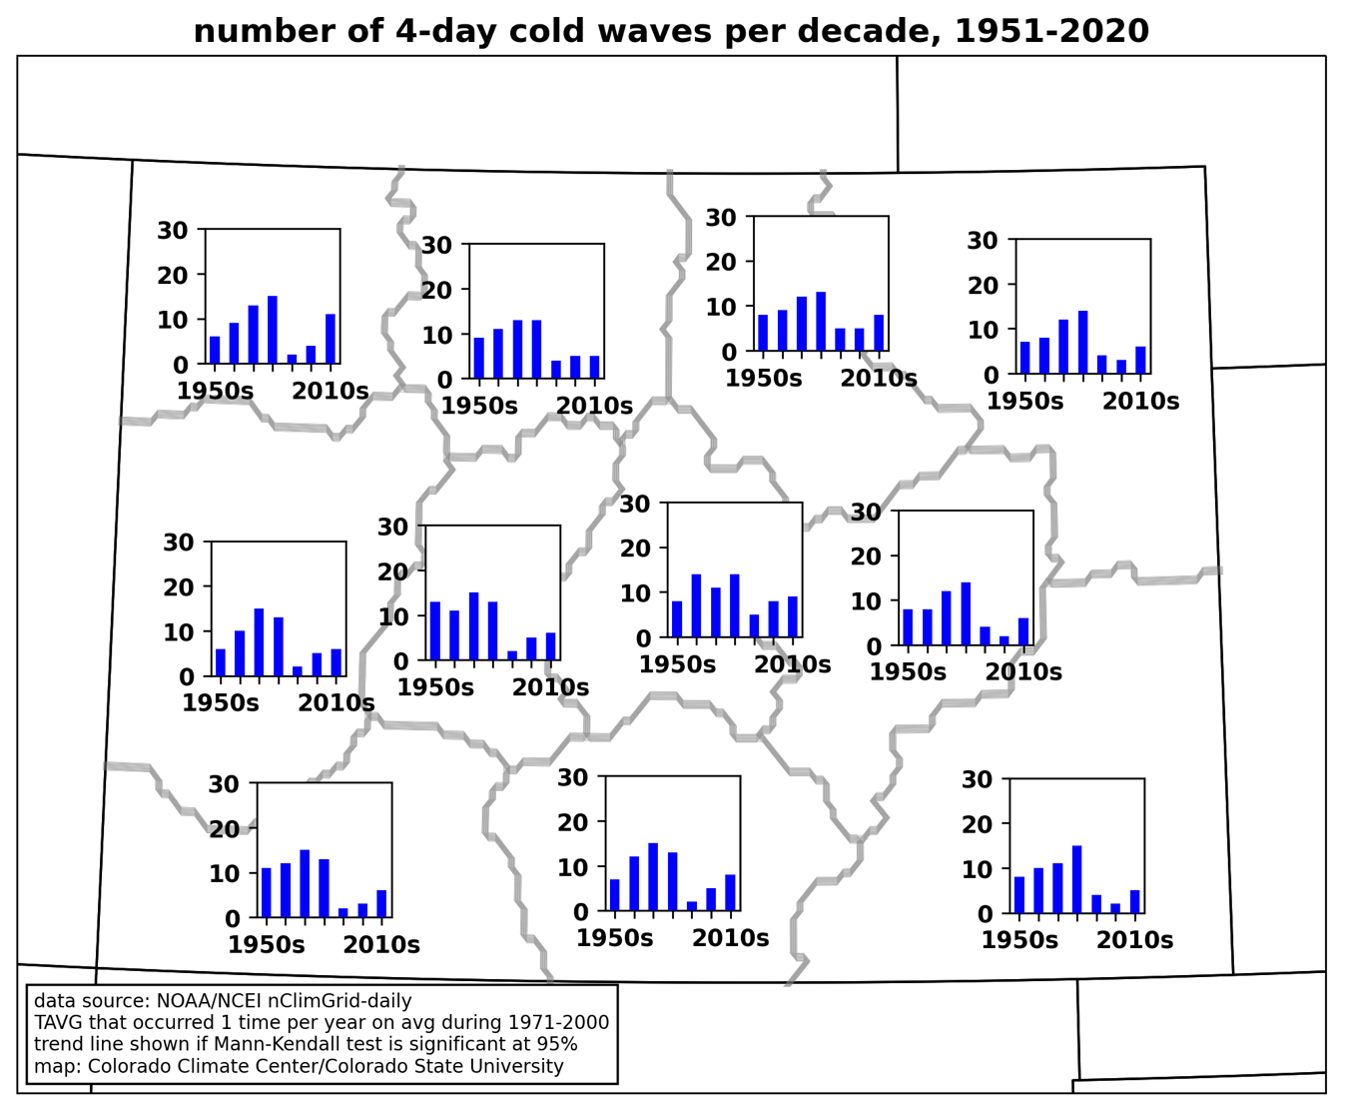
Cold waves have generally declined in frequency across Colorado from 1951-2020, but the decline is much less pronounced than the increase in heat waves (Fig. 4.3). The decrease in 4-day cold waves was not found to be statistically significant in any of the climate divisions. In most divisions, the 1970s and 80s had a large number of cold waves; then, they declined in the 1990s and 2000s before increasing slightly in the 2010s.
Research has consistently indicated that heat waves are likely to increase in frequency and intensity in a warmer climate (Domeisen et al. 2023). In one study relevant to Colorado, Cowan et al. (2020) examined what would happen if the anomalous conditions associated with the Dust Bowl-era heat waves occurred in the present-day climate. They found that those 1930s heat waves that had a probability of around 1 in 100 years, would have a probability closer to 1 in 40 years today (and a higher probability in an even warmer climate). They also illuminate the impact of dry springs, noting that summer heat waves are generally more frequent and intense following a dry spring as compared to a wet spring.
The 32 CMIP5-LOCA model projections for medium-low emissions scenario RCP4.5 (described in Chapter 2.2) were analyzed using the same definitions of heat waves and cold waves that were used for observed conditions. Specifically, the 4-day average temperature (hot or cold) that was exceeded on average once per year during 1971-2000 was identified in each individual model run, and then occurrences of those temperatures in daily CMIP5-LOCA output from 1951-2090 were tabulated.
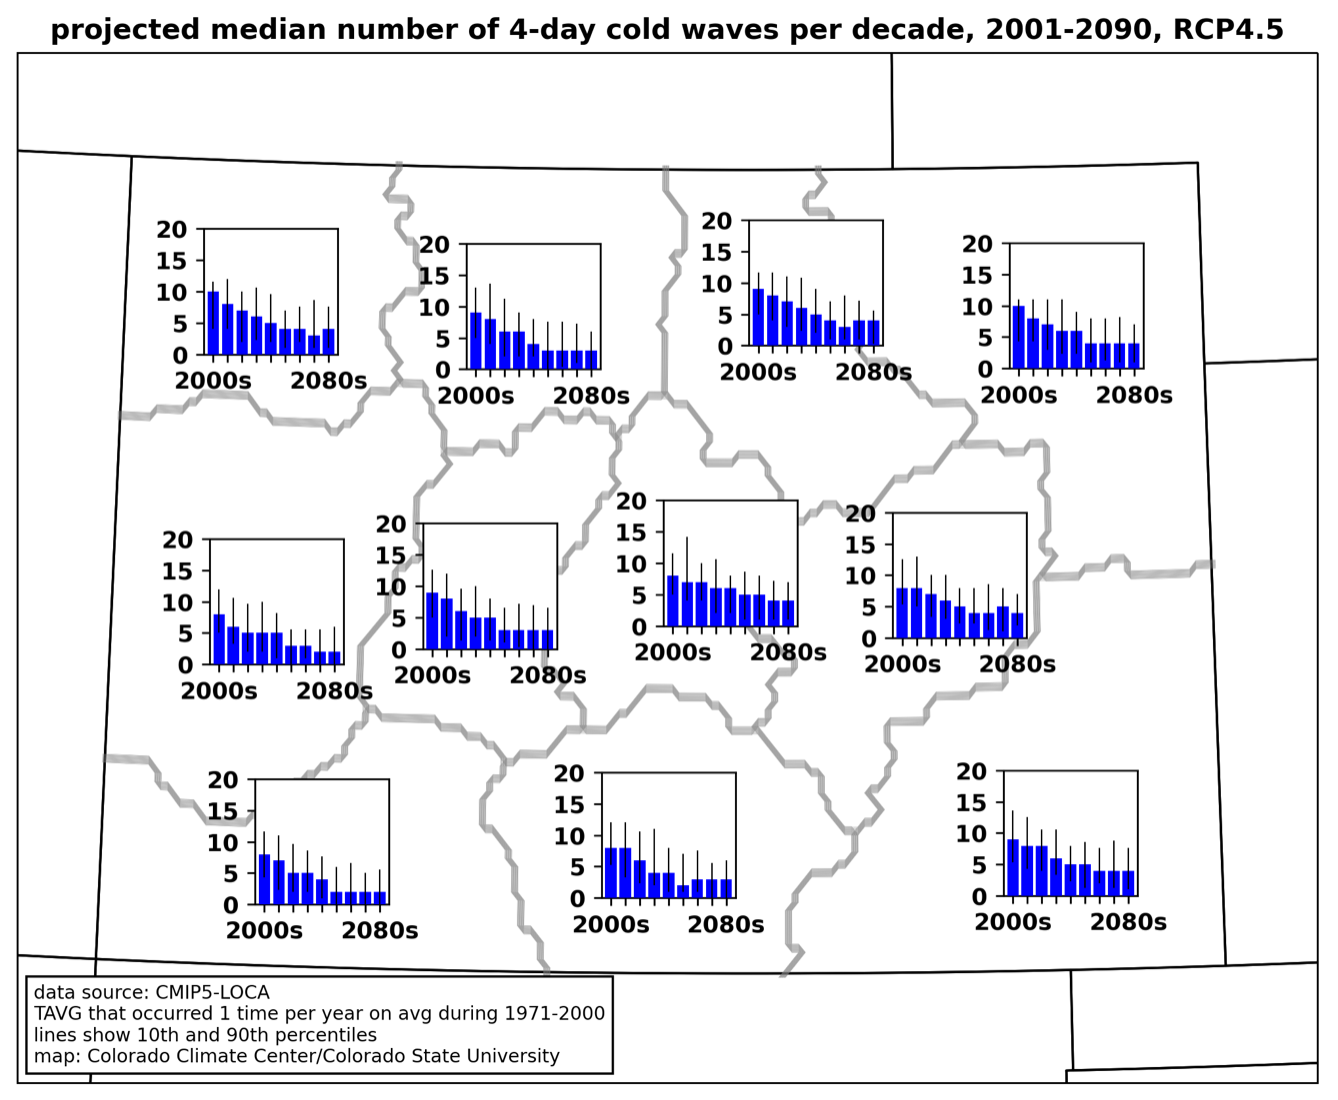
Heat waves are projected to increase at a rapid pace in all parts of Colorado as the climate warms. In most regions, the median number of projected heat waves is expected to increase from 1 per year during 1971-2000 (by definition; not shown), to approximately 10 per year by the 2060s (Fig. 4.4). Some projections show a smaller increase in the number of heat waves, others a much larger one. All model projections show a statistically significant increase in heat waves from the 1950s to the 2080s in all regions; at least 90% of the model projections show a significant increase in heat waves from the 2000s to the 2080s in all regions except the Southeast (where there is 87.5% agreement among models for a significant increase). To put these results in other terms: what would have been the hottest 4-day period of each year during 1971-2000 is projected to occur approximately 10 times--spanning 40 days per year--by the 2060s.
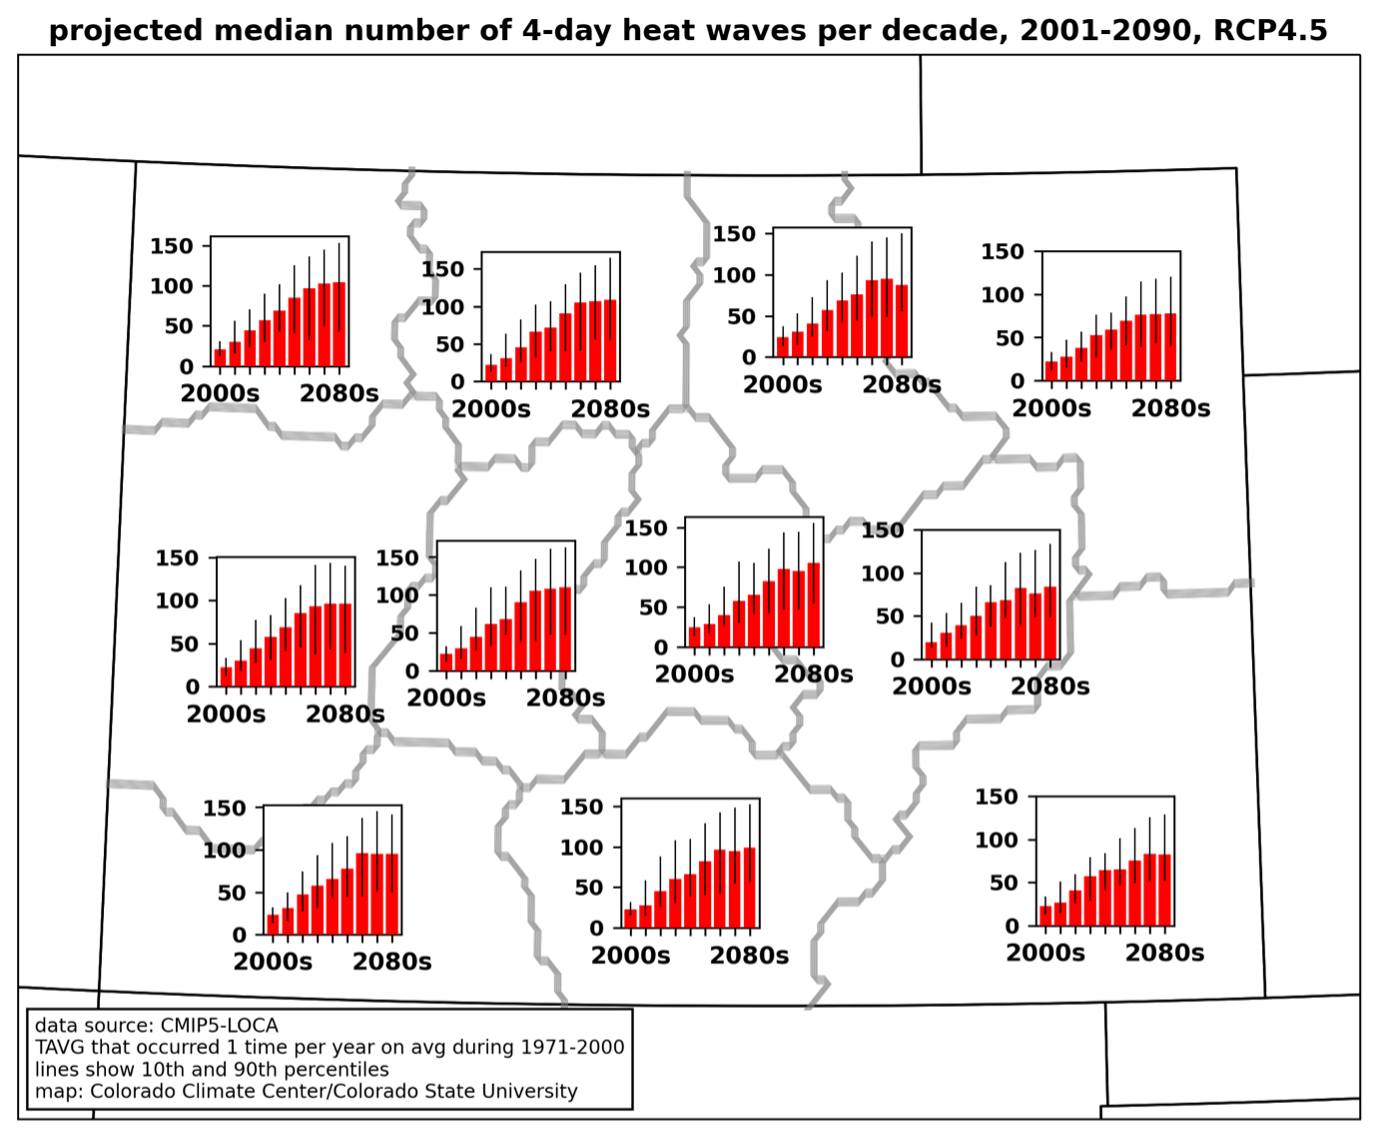
Figure 4.4
Time series of the number of 4-day heat waves per decade from 2001-2090 in CMIP5-LOCA projections for each cli- mate division. (See Fig. 2.2 for the names of the divisions.) The red bars indicate the median projection for each decade, and the lines indicate the 10th and 90th percentile of the 32 projections. Heat waves are defined as a 4-day period in which the daily mean temperature (the sum of the daily maximum and minimum temperatures divided by two), averaged over the four days, exceeds the 4-day average temperature that was modeled on average once per year during 1971-2000 in each individual model projection.
Although extreme cold is also generally expected to decrease in frequency as the climate warms (e.g., USGCRP 2017), in Colorado, both observations (Fig. 4.3) and future projections (Fig. 4.5) indicate that cold waves will not decrease nearly as much as heat waves increase. Whereas model projections indicate that heat waves will increase in frequency by as much as ten-fold, similarly defined cold waves are projected to decrease in frequency by half, or even less, depending on the region (Fig. 4.5). There is also much less agreement on the robustness of the trend: fewer than half of CMIP5-LOCA projections show a statistically significant decrease in 4-day cold waves across the 21st century. In most regions, the frequency of cold waves decreases from roughly once per year in the early 21st century, to roughly once per two years by late century.
The strong asymmetry in the projections of heat waves and cold waves in a warmer climate is likely to have impacts on the agricultural sector in Colorado. As one example, western Colorado has had several instances in the early 21st century of extremely hot summers punctuated by strong cold waves in the fall and spring that have led to the loss of fruit crops (NOAA 2020a). Challenges such as these may become more acute in the future, as periods of extreme heat become much more frequent, but the risk of extreme cold remains.
Most simply defined, drought is insufficient water to meet demands. Drought is most commonly assessed as a deficit of precipitation, snowpack, soil moisture, and/or streamflow across timescales from months to years. Temperature has played a critical role in increasing the severity of recent droughts in Colorado and the Southwest U.S.
Conventional monitoring of droughts has focused on defining extreme deficits in each of the water variables. Historically, the Palmer Drought Severity Index was widely used and included both temperature and precipitation. However, it was insufficient for certain regions of the country and fixed on one time scale (correlating well with 9-month analyses). For precipitation, the Standardized Precipitation Index (SPI) introduced methods to assess the severity of drought on varying timescales (McKee et al. 1993). Because of its versatility to work well both spatially and temporally, it became a primary tool for monitoring drought, but it did not consider the temperature aspect of drought.
Warmer temperatures during drought result in higher evaporative demand. Evaporative demand describes the atmosphere’s “thirst” for moisture (see Chapter 3.5). Drought severity can be exacerbated by high evaporative demand; in conjunction with moisture deficits, the atmosphere is trying to take more water away from the surface (through evaporation and transpiration). To better capture this phenomenon, new indicators and indices have been introduced into regular drought monitoring, including the Standardized Precipitation Evapotranspiration Index (SPEI) (Vicente-Serrano et al. 2010), the Evaporative Demand Drought Index (EDDI) (McEvoy et al. 2016), and vapor pressure deficit (VPD) (Lowman et al. 2023).
The Standardized Precipitation Evapotranspiration Index has expanded the utility of the SPI by adding a temperature component to the index. The distinction between SPI and SPEI over longer time periods illustrates the differences between precipitation-driven droughts that occurred historically and the droughts driven by the combination of low precipitation and warmer temperatures since 2000.
Looking at a time series of 24-month SPI since 1895 (Fig. 4.6), there are 8 significant dry periods, including the drought at the turn of the 20th century, the Dust Bowl in the 1930s, major droughts in the 1950s, 1960s, and 1970s, and three periods since 2000. The SPEI time series suggests nearly continuous drought since 2000 (Fig 4.7). This illustrates that because of higher temperatures, not only are times of drought more severe, there may be less benefit and recovery during wetter times. This phenomenon, increasingly prevalent in the 21st century, has been termed “hot drought” (Udall and Overpeck 2017).
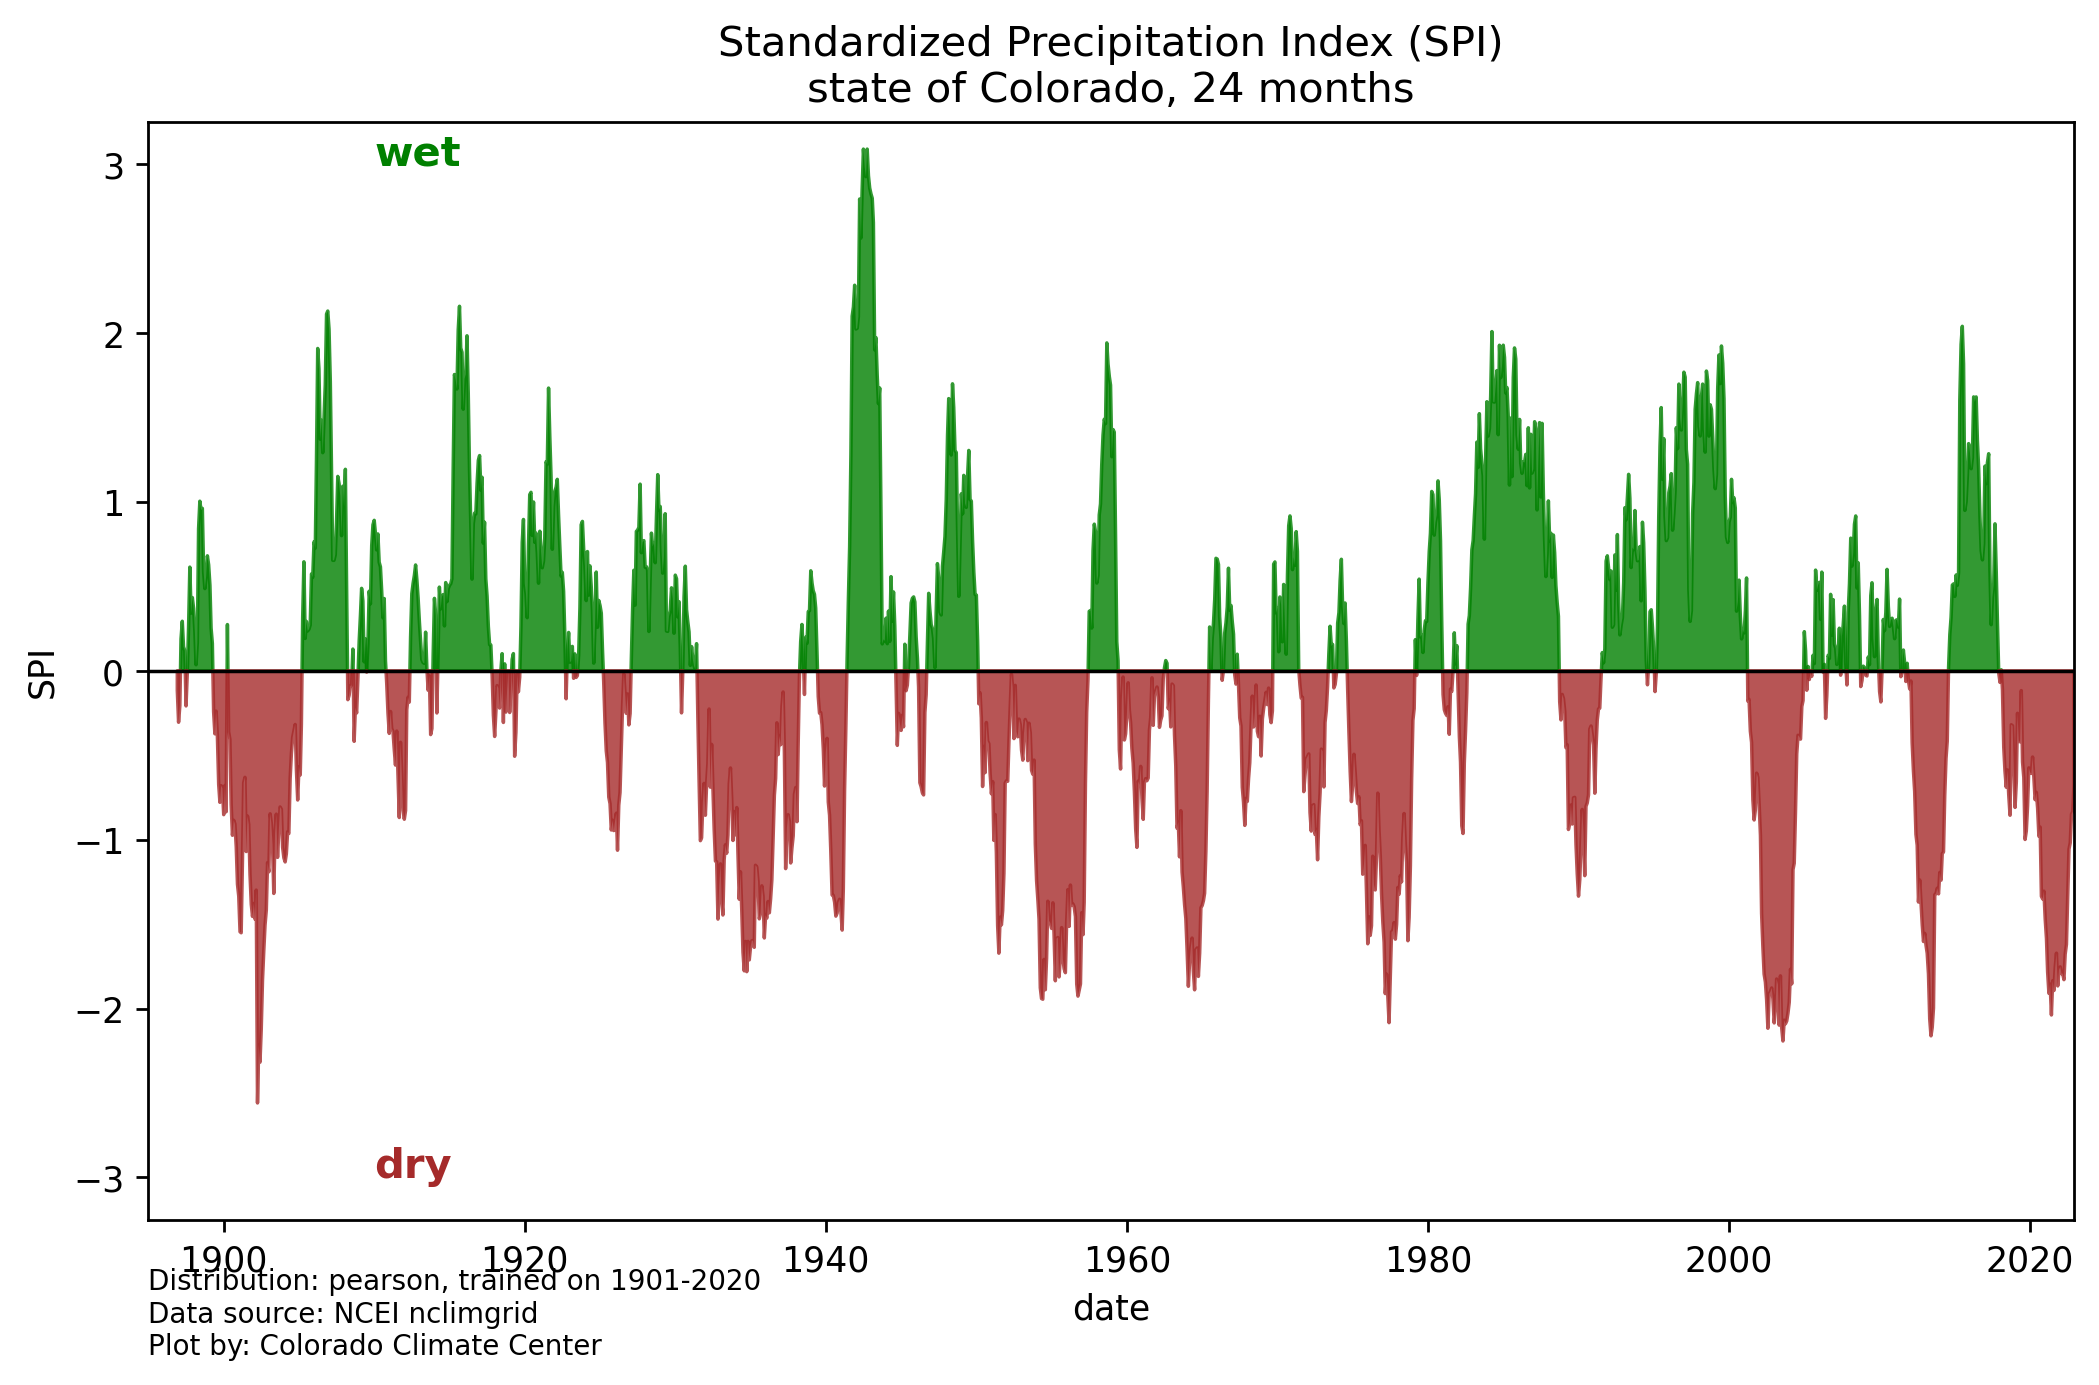
Figure 4.6
24-month Standardized Precipitation Index for Colorado. Data were fit to a Pearson distribution using NOAA nClimGrid data from 1901-2020.
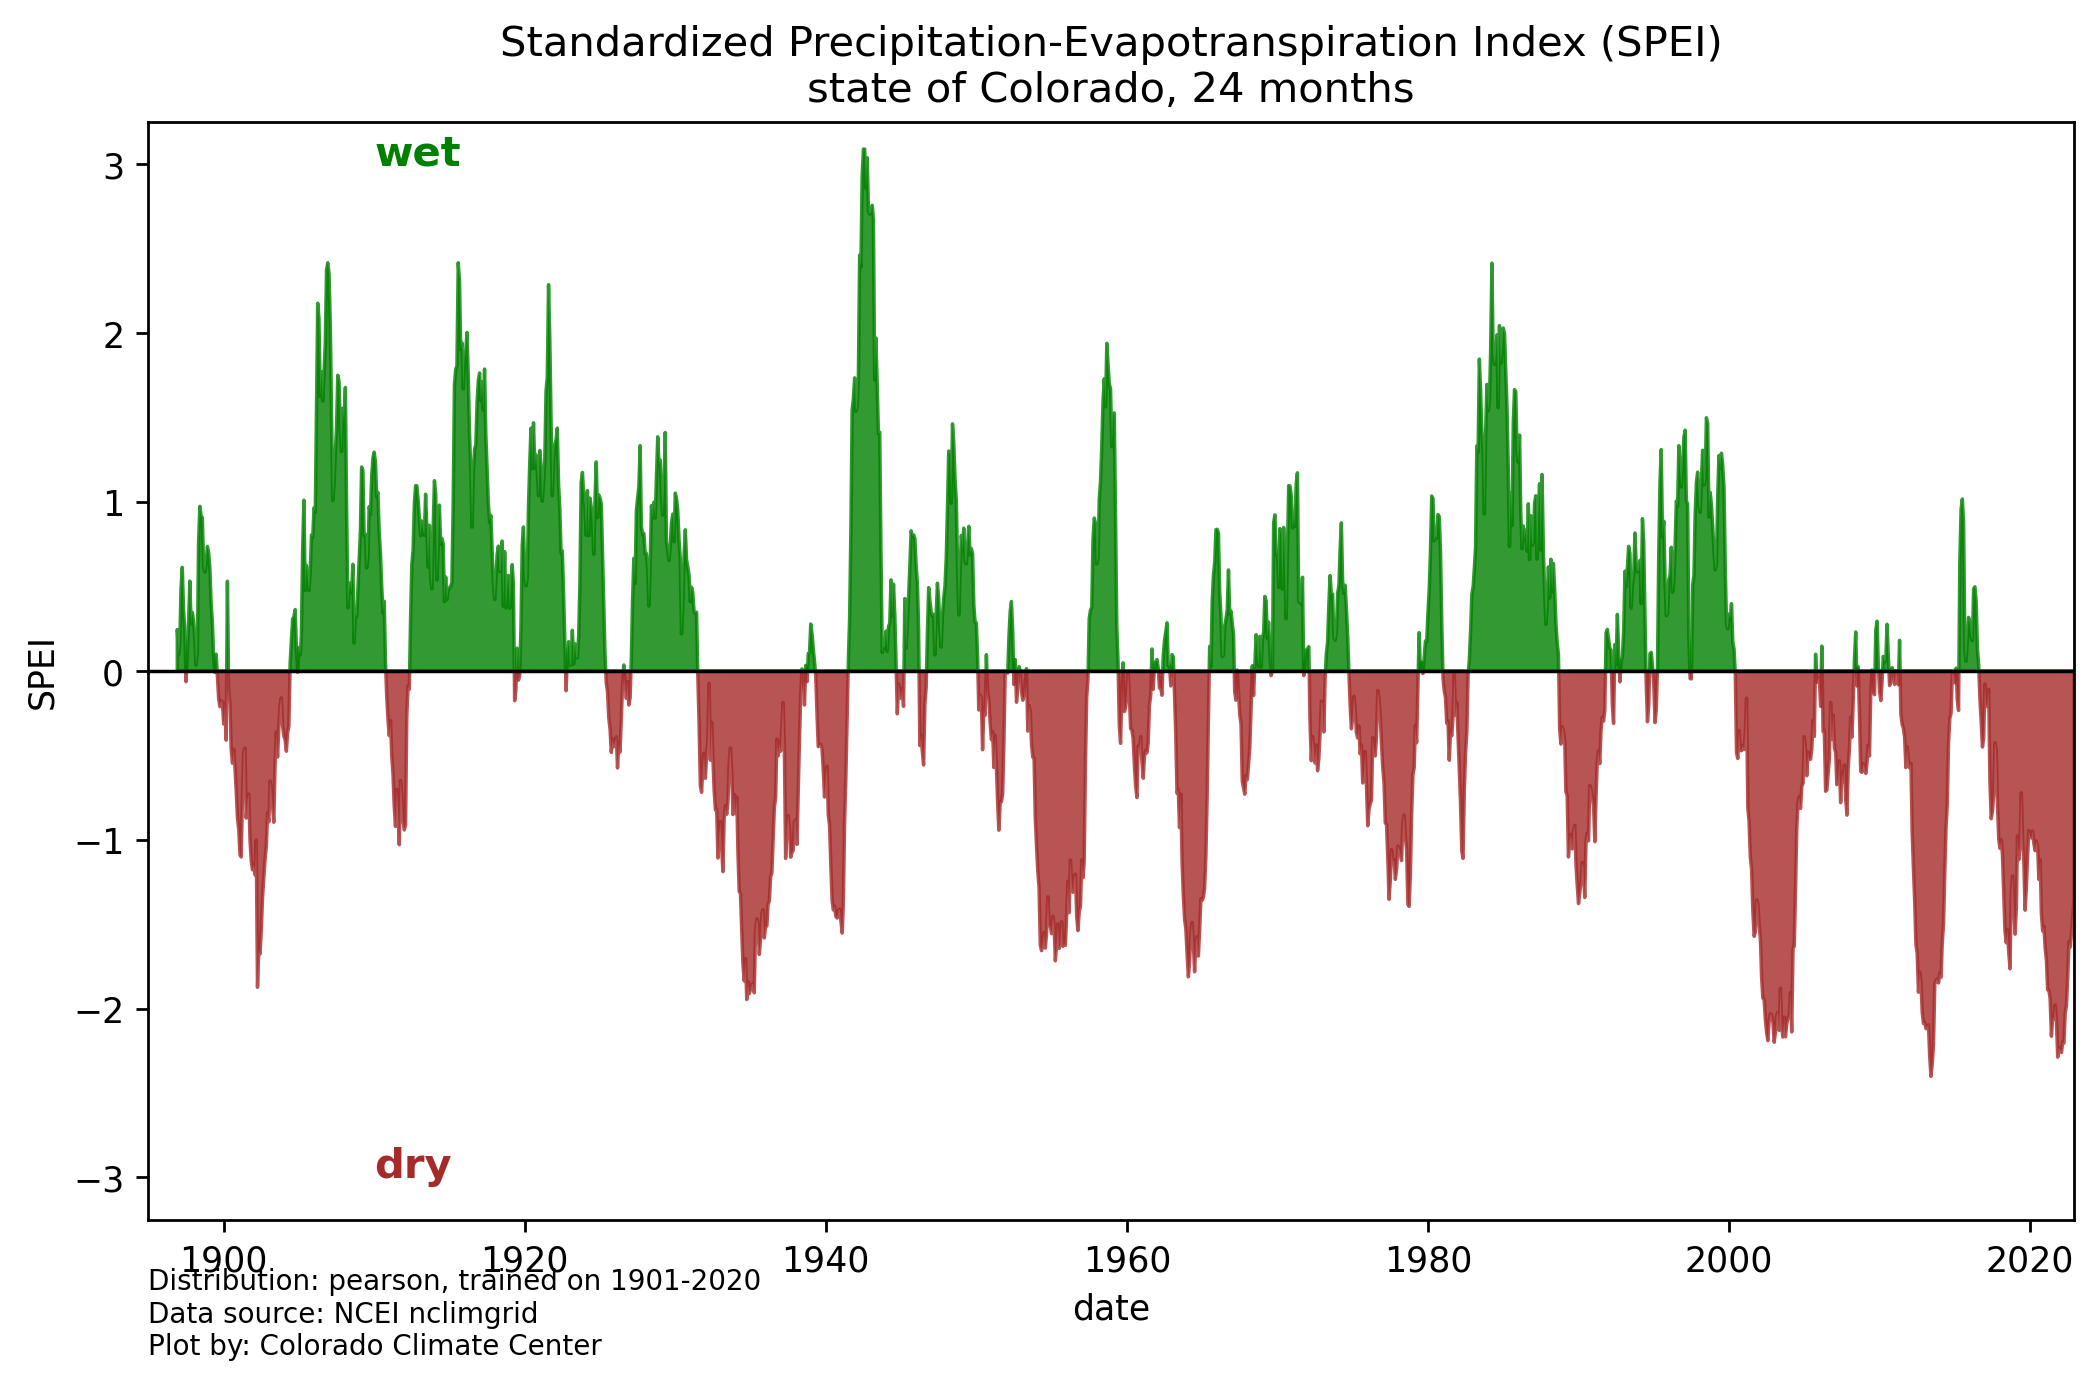
Figure 4.7
As in Fig. 4.6 but for Standardized Precipitation-Evapotranspiration Index. Potential evapotranspiration was calculated using the Thornthwaite method.
Each of the significant drought periods of the 21st century – centered around 2002, 2012, and 2020 – exhibited the indicators that we typically expect with droughts: low peak snowpack and early runoff, decreased streamflows, dry soils accompanying very hot summers, and high evaporative demand. Subsequent studies of these drought periods find that certain events would not have been as severe if the climate were not warming. In addition to Udall and Overpeck (2017), Williams et al. (2020) and Williams et al. (2022a) found that the 21st century megadrought over the Southwest would not have been a megadrought in terms of duration or severity without climate change. A NOAA Drought Task Force assessed conditions in the Southwest during the 2020-2021 drought period (Mankin et al. 2021). They found that precipitation deficits over those two years, although exceptionally low, had the same likelihood of occurring in past decades (1950-2000). They also evaluated VPD, which Lowman et al. (2023) simply describes as “high atmospheric aridity.” VPD tends to be elevated during drought, ultimately impacting plants’ growth and photosynthetic activity. Observed VPD during the 2020-2021 drought had virtually no chance of occurrence in the 20th century but is more likely to occur in future climate scenarios. Mankin et al. (2021) concluded that increased VPD in 2020-2021 made the drought worse. Regardless of changes in precipitation, rising temperatures are making droughts more severe and frequent.
Williams et al. (2020, 2022) found that anthropogenic climate change in the CMIP6 (CMIP5) climate models contributed 42% (46%) to soil moisture deficits in the Southwest U.S. for the 2000-2021 time period. Precipitation simulations are a large source of uncertainty in the models, but there is strong agreement that warmer temperatures (where confidence in future scenarios is much higher) result in a net drying effect across the Southwest (including Colorado). This drying effect, shown in soil moisture anomalies, reduction in snowpack, and increased evaporative demand, increases the likelihood of widespread and severe droughts over the region (Williams et al. 2022b).
Future projections of VPD (Mankin et al. 2021) highlight the relationship between atmospheric demand and temperatures. Future VPD increases can be attributed to increasing temperatures. The high VPD observed from 2011-2020 over the Southwest (and specifically during the 2020-2021 drought) is likely to occur more frequently in future projections (2030-2050).
Despite uncertainty in future precipitation projections, droughts are projected to increase in frequency and severity for Colorado (and the Southwest in general) because of warmer temperatures.
The occurrence and behavior of wildfires in the western U.S. are strongly influenced by weather and climate, and they are especially linked to drought conditions (Littell et al. 2009; Hostetler et al. 2018). Below-normal winter and spring precipitation and early meltout of the snowpack are linked with dry fuels and greater fire activity in subsequent months. Shorter periods of far-below-normal precipitation can lead to dry fuels and increased fire activity at any time of the year. High temperatures — whether as part of a drought or a long-term trend — hasten the drying of fuels, making fire ignition, fire spread, and intense fire behavior more likely. Fires are also much more likely to spread and exhibit intense behavior on days with high winds and low humidity. Note that in some vegetation types, such as grasslands and shrublands, wet growing seasons that lead to temporarily high fuel loads may be required for fire to spread during subsequent drier periods.
Wildfire occurrence and behavior are also driven by several non-climatic factors, such as the legacies of historical forest and land management (e.g., fire suppression) and resulting changes in fuel loads. Additionally, increasing human activity and development of houses and other structures within fire-dependent forest, shrublands, and grasslands leads to more ignitions year-round.
Over the past 20 to 40 years, the Western U.S. has experienced several linked trends in wildfires: large increases in annual area burned, number of very large fires (>10,000 acres), fraction of fire area burned at high severity, and length of the fire season (Dennison et al. 2014; Abatzoglou and Williams 2016; Westerling 2016; Parks and Abatzoglou 2020; Higuera et al. 2021; Parks et al. 2023). While these trends are also affected by non-climatic factors (Balch et al. 2017; Radeloff et al. 2018) and by multidecadal variability in precipitation, a critical common thread is the role of increasing temperatures. Two recent studies found that anthropogenic climate change, via warmer temperatures and resulting increases in fuel dryness across the region, could account for half or more of the recent increase in annual area burned (Abatzoglou and Williams 2016; Zhuang et al. 2021). However, Holden et al. (2018) found that, while acknowledging the role of warming temperatures, a declining trend in summer precipitation was the primary driver.
These West-wide increasing trends in wildfire are very clearly expressed in Colorado. Figure 4.8 shows the number of very large Colorado wildfires (over 10,000 acres), and the total area burned in those fires, from 1984 through 2020. From 1984-1999, there were 8 wildfires larger than 10,000 acres, and records suggest that only two additional fires that size occurred from 1950 to 1983. Since 2000, there have been 60 wildfires larger than 10,000 acres, including six fires larger than 100,000 acres; all but one of the latter occurred after 2017. The annual area burned by wildfires in the forested areas of Colorado, and adjacent areas of New Mexico and Wyoming, increased by over 300% from the 1984-2000 period to the 2001-2017 period. The average elevation at which these wildfires occurred shifted upwards by over 1000’ between 1984 and 2017, which is consistent with how warming is shifting temperature regimes upslope (Alizadeh et al. 2021).
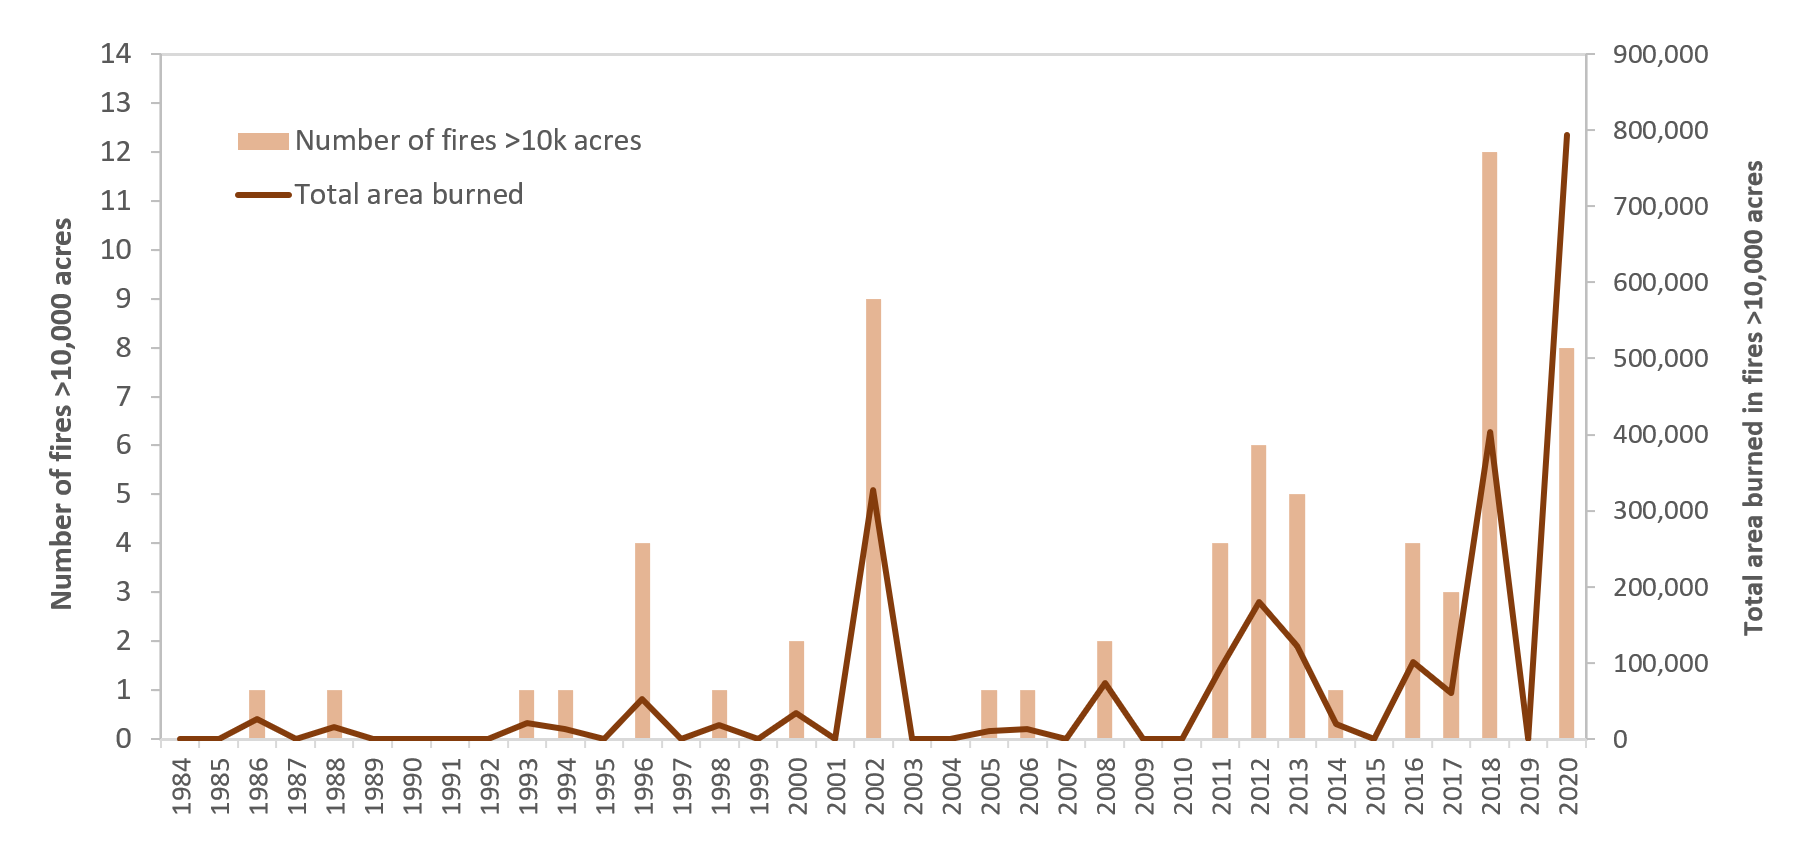
Figure 4.8
Number of Colorado wildfires that burned over 10,000 acres, 1984-2020, and total area burned in those fires each year. (Data: Monitoring Trends in Burn Severity (MTBS), https://www.mtbs.gov/direct-download).
Many studies have combined climate model projections with observed fire-climate relationships to estimate the impacts of future climate change on wildfires in Colorado and the Rocky Mountain West. These studies have uniformly indicated substantially worsened wildfire risk for Colorado by the mid-21st century compared to the late 20th-century, as additional warming further increases fuel dryness and enhances fire ignition and spread (Liu et al. 2015; Brey et al. 2021; Moritz et al. 2012; Pechony and Shindell 2010; Spracklen et al. 2009; Litschert et al. 2012; Yue et al. 2013; Abatzoglou and Williams 2016; Westerling 2016; Kitzberger et al. 2017; Littell et al. 2018; Abatzoglou et al. 2021; Brown et al. 2021).
Most of these studies quantified potential changes in annual area burned, collectively indicating a 100-500% increase under a warming of 2.5°F to 5°F (equivalent to RCP4.5 projections for mid-century). Under the same level of warming, Stavros et al. (2014) projected a 400% increase in the occurrence of very large wildfires (>50,000 acres). In short, studies consistently project a continuation of the recent increasing statewide trends in wildfire, given the near-certain continuation of the recent warming trend. However, some grassland and shrubland ecosystems in which fire is fuel-limited could see reduced fire occurrence as warming leads to overall lower fuel accumulation and continuity (Littell et al. 2018).
While post-fire changes to vegetation type, structure, and fuels could eventually limit how much new fire can occur on the landscape in each year or decade (Westerling et al. 2011), such feedback mechanisms will not prevent large, climate-driven increases in average annual burned area from occurring over the next several decades (Abatzoglou et al. 2021).
Heavy and extreme precipitation events occur when three main storm “ingredients” are at unusually high levels, including atmospheric moisture, the transport of moisture into the storm (convergence), and upward motion (lift) within the storm. During the warm season (April-September), most heavy and extreme precipitation events in Colorado occur in convective storms, such as supercell thunderstorms and larger mesoscale convective systems (MCS). They can also occur in larger-scale systems with front-driven lift and orographic (terrain-driven) lift, such as during the Front Range floods in September 2013 (Gochis et al. 2015). The precipitation in warm-season storms usually falls as rain or hail, leading to flooding risk. During the cold season (October-March), heavy and extreme precipitation is associated with strong mid-latitude cyclonic storms with both frontal and orographic lift. While precipitation in cold-season storms generally falls as snow at all elevations (see Winter Storms, section 4.9), heavy rainfall and flooding risk can occur at lower elevations (~6000’ and below), especially in the ‘shoulder’ months (October and March).
There are substantial differences between the eastern and western slopes of Colorado in the frequency, magnitude, and seasonality of heavy and extreme precipitation events, along with the prevalent storm types associated with these events. In particular, eastern Colorado is much more prone to strong convective storms; thus, rainfall events of a given frequency (e.g., 1-year) are generally much larger than in western Colorado (Mahoney et al. 2013).
Of the main storm ingredients, only atmospheric moisture has a direct physical link to temperature, through the Clausius-Clapeyron (C-C) equation. The application of the C-C equation to water vapor says that for every 1°C rise in temperature, the moisture-holding capacity (saturation vapor pressure) of the atmosphere increases by 6.5%--or 3.5% for every 1°F rise (Brune 2023). Not every storm in a warmer climate will necessarily drop more precipitation than previously; but in general, with other factors held the same, storms will have access to more moisture in a warmer climate. Atmospheric instability, which influences the lifting of air parcels in convective storms, also tends to be greater under warmer temperatures, although the relationship is not as direct or as strong as with moisture (Mahoney et al. 2018).
Definitions can vary; here we use “heavy” to refer to events expected to occur in a given location once per year or less frequently, and “extreme” to refer to events expected to occur every 20 years or less frequently. Thus, depending on the location in Colorado, a “heavy” event is at least 1”-2” of precipitation over 24 hours, while an “extreme” event is at least 2”-4” of precipitation over 24 hours.
In the southwestern U.S., including Colorado, there have been some indications of increasing trends in heavy and extreme precipitation over the past several decades (Westerling et al. 2011; Kunkel et al. 2020). For other metrics and time periods that were analyzed, increasing trends have not been ob- served (Bonnin et al. 2011; Hoerling et al. 2010; Lehmann et al. 2015). By comparison, in the Eastern and Midwest regions of the U.S., increasing trends are stronger and more consistent across different metrics of heavy and extreme precipitation and across different time periods.
The total from heavy and extreme precipitation events as a fraction of annual precipitation has increased since the 1950s in the six-state Southwest region (CO, UT, NM, AZ, CA, NV). Over the same region, the magnitude of every-20-year, 24-hour event has increased (USGCRP 2017). Across a range of event durations (1-day to 30-day), Kunkel et al. (2020) found that for the four-state Southwest (CO, UT, NM, AZ), the amount of precipitation falling in heavy (1-, 2-, 5-, and 10-year) and borderline extreme (20-year) events had generally increased from 1949-2016 and from 1979-2016. These increases were larger and more consistent in the warm season than the cold season.
Atmospheric moisture (precipitable water; PW) over Colorado and the surrounding states is ob- served to have increased from 1979 to 2016 by 0-8%, overall less than C-C scaling would suggest (Kunkel et al. 2020). It is possible that over the southwestern U.S., multi-decadal natural variability in the climate has suppressed the general effect of warming temperatures and increased regional precipitable water on heavy and extreme precipitation (Hoerling et al. 2016). Specifically, the prevalence of La Niña conditions since 2000 may have led to fewer such events in our region.
Given the near-certain continuation of warming for the rest of the 21st century, the C-C equation points to continued increases in atmospheric moisture globally (by 3.5% per 1 degree F) and a strong potential for increases in heavy and extreme precipitation. A very basic assumption is that the amount of precipitation in those events would increase, on average, according to C-C scaling. Under this assumption, 4°F of additional warming would lead to heavy and extreme precipitation events that are about 15% larger than without any warming. Whether that C-C-based “juicing” ultimately leads to that level of overall increase in extreme precipitation for Colorado depends on whether the future frequency of the different types of weather patterns that produce extreme precipitation, and other storm “ingredients” such as moisture convergence and lift, also change. Some observational studies have found evidence of “super-C-C scaling,” i.e., that convergence and/or lift have changed or interacted with warming so that the overall effect is to increase precipitation amounts beyond the C-C relationship, especially for short-duration (< 3-hour) events (Fowler et al. 2021).
The ability of climate models to simulate these other storm ingredients is limited by the relatively coarse spatial resolution of the models, especially for convective storms. A review of the different mechanisms by which climate change could affect extreme precipitation in Colorado and New Mexico concluded that the C-C-driven increase in atmospheric moisture with warming temperatures is likely to take precedence over the other effects (Mahoney et al. 2018).
Studies based on climate model projections (CMIP5 and CMIP6) for Colorado and the Southwest have consistently indicated overall future increases in the magnitudes of heavy and extreme precipitation events for our region, generally following the C-C scaling (Kharin et al. 2013; Wuebbles et al. 2014; Janssen et al. 2016; Lynker 2019; Swain et al. 2020; Rupp et al. 2022; Pierce et al. 2023). Again, even when downscaling, these studies based on global climate models poorly represent the shorter-duration convective storms that are important sources of extreme rainfall events in Colorado. The only recent study specific to Colorado, conducted on behalf of CWCB, projected the future change in the 24-hour, 100-year precipitation event for 28 grid boxes (1° by 1°) covering Colorado (Lynker 2019). This analysis found that under RCP4.5, most of the grid boxes over the state would see 2% to 12% increases in 24-hour, 100-year events by 2050. Additionally, under RCP8.5 with higher warming, most grid boxes would see increases of 8% to 20% by 2050. The upper ends of these changes are approximately equivalent to C-C scaling. This study did not show any consistent discrepancies between different parts of Colorado with respect to future changes in extreme precipitation.
Flood events are very obviously linked to heavy and extreme precipitation, but they are also influenced by many factors, including characteristics of the watershed (geology, slope angles, vegetation, soil texture and depth, extent of impervious (e.g., paved) surfaces, urban drainage system). They are also influenced by the stream channel itself, which is often modified extensively by human activity (dams, diversions, channelization). Other factors that vary more over time, such as the level of soil moisture or the presence and depth of snowpack, can also play an important role. As a result, the in- tensity of a flood event may not match the intensity of the underlying precipitation event; a ‘100-year’ rainfall can produce a 10-year flood, a 100-year flood, or a 1000-year flood, depending on these other factors.
In Colorado, floods occur almost entirely during the warmer half of the year (April-September), driven by either short-duration (< 6 hours) convective storms or longer-duration, broader-scale storm systems. Especially on the Western Slope, flooding also occurs from the melting of unusually large snowpacks. Such snowpacks typically arise from multiple heavy or extreme precipitation (i.e., snowfall) events during the cold season.
Watersheds that have recently burned in a wildfire, especially if the burn severity was high, are at much greater risk of flooding than unburned watersheds. Fire-induced changes to vegetation and soil properties mean that surface runoff and flooding can initiate at much lower precipitation intensities and total amounts, as little as 0.25” in one hour.
There is limited evidence suggesting increases in flooding in Colorado in recent decades. A recent global analysis of trends in flooding examined over 10,000 gaged streamflow records, including about 40 in Colorado (Slater et al. 2021). Most of those gages in Colorado showed declining trends since 1970 in the size of the 20-year, 50-year, and 100-year flood events; however, many of these gages re- flect extensive human modification of the streamflow regime. Increasing trends in floods were seen at about one-third of the gages, mainly on the Front Range and in northwestern Colorado. Two earlier studies that looked at U.S. trends in the 1-year flood event (i.e., annual peak daily discharge), but only in near-natural gaged streamflow records, found no increasing trends at any of the eight gages in Colorado they examined (Villarini et al. 2009; Hirsch and Ryberg 2012). Note that analyses of gaged stream and river flows may not capture changes in flash flooding involving overland flow outside of channels or in smaller basins without gages, such as in the 2013 Front Range floods.
As described earlier, climate model projections indicate the likelihood of increased frequency and severity of extreme precipitation events for Colorado in the next several decades. Considered in isolation, these projected increases in extreme precipitation would lead to increased frequency and severity of flooding (Swain et al. 2020). However, the many factors that affect how rainfall is translated into runoff complicate the picture. In particular, the projected declines in summer soil moisture could be a countervailing factor. One study has found that semi-arid and semi-humid regions show smaller future increases in flooding than humid regions; in their model analysis, Colorado generally sees future declines in the intensity of the 30-year flood, despite increasing intensity of extreme precipitation (Tabari 2020).
Similar modeling by Brunner et al. (2021) for river basins in Europe found a threshold effect in the future translation of precipitation into flooding. This same effect may play out in Colorado: The drying of soil moisture and snowpack losses resulting from warming temperatures could counterbalance the increased magnitudes of the less-extreme precipitation events (< 10-year), leading to little or no change in less-extreme flood events. For more extreme precipitation events (> 50-year), the increased precip- itation magnitudes with climate change could overwhelm the effect of soil drying and translate into increases in the largest flood events. In the September 2013 Front Range flood event, whose intensity was likely exacerbated by warming (Trenberth et al. 2015; Pall et al. 2017), very extreme precipitation (50-year to ~1000-year) overcame dry antecedent soils to cause extreme flooding (Gochis et al. 2015).
Colorado regularly experiences severe convective weather, defined by the National Weather Service as a tornado, hail at least 1” in diameter, or thunderstorm wind gusts of at least 58 mph. Although severe storms can occur anywhere in the state, the vast majority of the impacts are along the Front Range and eastern Plains (Fig. 4.9). Nearly all thunderstorm hazards occur between March and October, with a peak in early June. Severe thunderstorms are very rare outside of these months. Notable recent severe thunderstorms in Colorado include the EF-3 tornado in Berthoud in 2015 (NOAA 2015), the wind damage from a derecho and a macroburst, two days apart in eastern Colorado in June 2020 (Childs et al. 2020), and the state-record hailstone with diameter of 5.25” in Yuma County in August 2023 (NOAA 2023a). Tornadoes in Colorado are frequent, but the vast majority are relatively weak. Although strong and damaging tornadoes (rated 2-3 on the Enhanced Fujita scale) occur occasionally in Colorado, violent tornadoes (rated EF-4 or EF-5) have not been observed in Colorado. Eastern Colorado, along with the adjacent states in the Great Plains, is one of the global “hot spots” for large hail (Raupach et al. 2021).
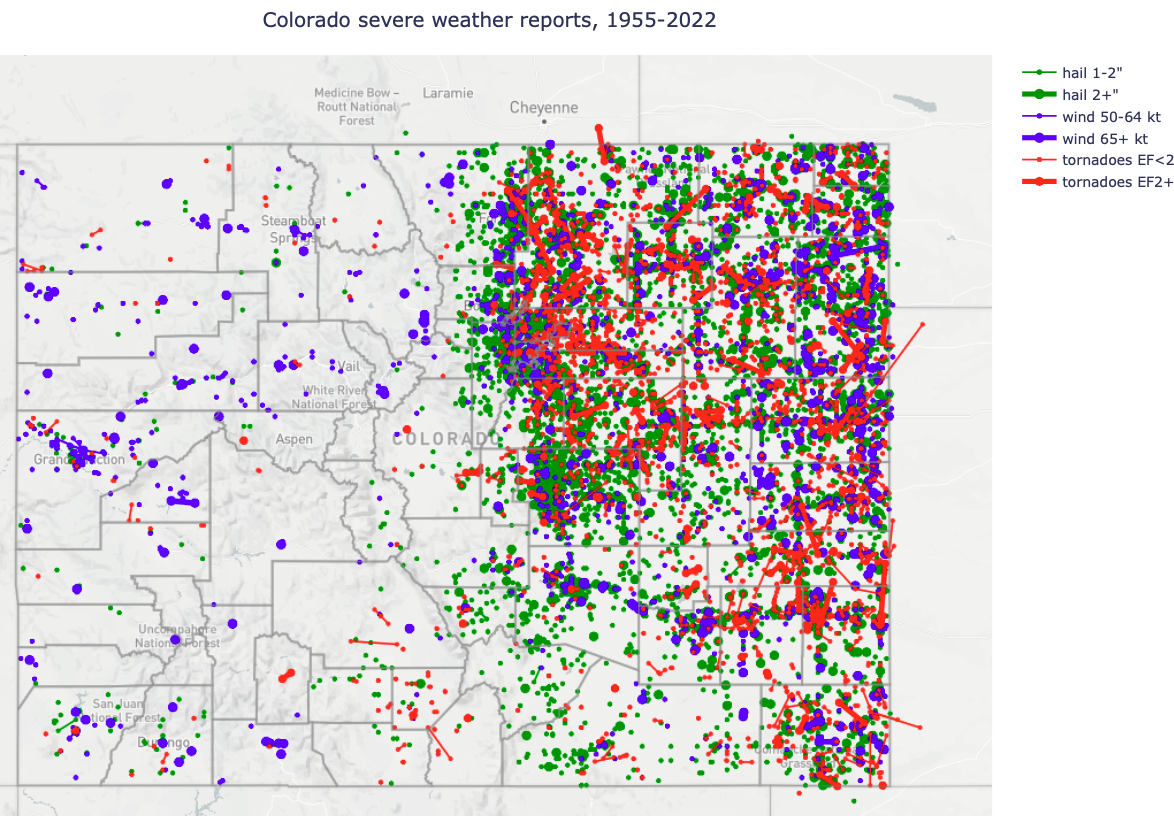
Figure 4.9
Map of severe weather reports from 1955-2022, based on data from the NOAA Storm Prediction Center. See https://climate.colostate.edu/severe_wx_climatology.html for an interactive version.
Long-term trends in hazardous convective weather are very challenging to identify because the data largely come from reports from storm spotters and the public. As the population of Colorado has grown, awareness of severe weather has increased, and the ability to easily submit reports has expanded. There are upward trends in severe weather reports that result from these non-meteorological factors. Childs and Schumacher (2019) closely examined the observed trends in tornadoes and severe hail and connected them to both meteorological and non-meteorological causes. They found that from 1997-2019, when severe weather reports have been more systematically collected, there was a slight downward trend in tornadoes in Colorado but an increasing trend in severe hail. They also found an upward trend in the ratio of “significant” severe hail (at least 2” in diameter) reports to those of 1” in diameter. Using a different method, Tang et al. (2019) showed that from 1979-2017, most of the continental U.S. experienced an increase in the number of days with the potential to produce large hail, but in eastern Colorado, there was actually a significant decrease in the number of days. The decrease in eastern Colorado was noted to be “puzzling” and worthy of further investigation. Overall, because of the relatively short data record for these hazards and the influences of changing observation systems, the sign and magnitude of long-term changes remains uncertain (Raupach et al. 2021).
The influences of climate change on hazardous convective weather in the future are also uncertain. Mahoney et al. (2012) used numerical model simulations to show that in a warmer climate, despite increased intensity of thunderstorms overall, the occurrence of hail will be greatly reduced owing to an increase in the height of the melting level. The review by Raupach et al. (2021), as well as Brimelow et al. (2017) and Trapp et al. (2019), similarly concluded that the average size of hailstones reaching the ground will increase in a warmer climate. In other words, hail frequency may decline, with what would have been small hail instead falling as rain, but when hailstorms do occur, they are more likely to produce large hail. Using various proxies for hail in downscaled climate simulations, Childs et al. (2020) found that in northeast Colorado, environments supporting severe hail will occur on 2-3 additional days per year in the future compared to the late 20th century, with smaller increases along the Front Range and southeastern Colorado. They also found that the changes in the impacts of severe hail (e.g., human exposure and damage) will be more sensitive to future changes in population than to changes in hailstorms themselves—something that is true of many weather and climate hazards. If Colorado’s population continues to grow rapidly and the climatology of hailstorms remains similar to the present day, then exposure could more than double. However, if hailstorms shift to occur more frequently over eastern Colorado where population is projected to remain steady or decline, then overall human impacts from hail could decline in the future but impacts to agriculture could increase.
Regarding tornadoes, the results from Childs et al. (2020) echo those for hail in Colorado: In the future, a modest increase in days favorable for tornadoes in northeast Colorado is likely, with future trends in impacts driven much more by population changes than changes in tornado occurrence. The influence of climate change on convective wind events in Colorado has not been systematically studied. The derecho of 6 June 2020 (NOAA 2020b) across the western U.S. produced the largest number of severe wind reports on a single day in Colorado history, but it is unclear whether this event can be attributed to climate change in any way. (See section on non-convective windstorms for discussion of other types of wind hazards.)
In summary, for all three hazards (hail, tornado, and winds), there remain large uncertainties regard- ing future changes, as data limitations and the infrequent and localized nature of these storms makes them challenging to study in the context of a changing climate.
Colorado’s topography, and a location that often intercepts the midlatitude jet stream, makes it prone to extreme wind. In particular, the Front Range from Fort Collins to Pueblo is prone to downslope windstorms, where air flowing eastward over the mountains rapidly descends and results in extreme gusts (American Meteorological Society 2022). Several damaging windstorms in Boulder, such as 11 January 1972, which had gusts of nearly 100 mph (Lilly and Zipser 1972) and 17 January 1982, which had a gust measured at 137 mph at the NCAR Mesa Lab (Zipser and Bedard 1982), motivated extensive research on the causes of downslope winds. The devastating Marshall Fire in December 2021 was also fueled by a downslope windstorm with gusts up to 115 mph (NOAA 2022). (See section below on compound events.)
Other areas in Colorado’s high country are also prone to extreme winds. Longs Peak had a wind gust of 201 mph in 1981, which is unofficially considered the state record, but it was measured at a temporary weather station as part of a research project. Other mountain areas routinely experience wind gusts exceeding 100 mph. The eastern plains can also experience extreme non-thunderstorm winds, such as a 107-mph gust at Lamar that occurred in December 2021.
Unfortunately, long-term changes in wind are difficult to quantify because data records for wind, especially wind gusts, are generally much shorter and less complete than records for temperature and precipitation. Detailed wind measurements generally require automated instrumentation, which only came into widespread use in the 1990s. Worldwide, there was some evidence for a “global stilling” trend (i.e., a slowing of average wind speed) that began in the 1980s, but this trend was found to have reversed after 2010 (Zeng et al. 2019). Using data from the Colorado Agricultural Meteorological Network, Goble (2018) found that from 1996-2018 average wind speeds declined in all seasons and all parts of the state, except for the western slope in spring. However, this study did not address wind-storms specifically and was based on a relatively short data record. Future changes in extreme winds are highly uncertain, but changes notwithstanding, the threat for extreme winds in Colorado will remain.
While we’ve observed increasing trends in cold season temperatures (Chapter 2) and fewer cold waves (Chapter 4.1) in recent decades, it is more challenging to assess how winter storms have changed, or may change in the future. “Winter storms” encompasses a broad range of natural hazards such as heavy snowfall, ice accumulations, high winds, and cold temperatures. The physical mecha- nisms required for most winter storms are large-scale in nature – associated with the troughs along the polar jet stream, low pressure centers, and cold fronts. These large-scale events can leave a trail of impacts that extend across the entire country. For example, in February 2021, a major winter storm brought extreme cold, snow, and ice accumulations that impacted states from Oregon to Alabama (Bolinger et al. 2022). In Colorado, record-low temperatures were observed across many parts of the eastern plains, with the primary impact being power outages.
Due to the complexity of winter storms, identifying trends (both historic and projected) is difficult. Changes in large scale factors are one option. For example, Cohen et al. (2021) found that Arctic amplification – where the higher latitudes are warming at a faster rate than the tropics, thus weakening the jet stream and resulting in a wavier pattern – is evident in observations and connected with changes in mid-latitude winter weather patterns. In theory, the wavier pattern of the jet stream would have more ridges and troughs, potentially increasing the frequency of winter storms. These connections are not represented in climate models, and the dynamic mechanisms are still being debated (Moon et al. 2022). Additionally, Blackport and Screen (2020) found that Arctic amplification does not necessarily mean more waviness, and recent reported trends toward a wavier circulation had reversed.
Identifying trends at a local level can also be challenging. Each winter storm is the collation of several different variables. Some characteristics of winter storms – cold fronts, freezing rain, high winds – are difficult to measure and assess over time. Measurement protocols for snowfall have also been inconsistent over time (Doesken and Judson 1997). Variables estimated from well measured observations of temperature and precipitation (such as cold waves or snowfall accumulations) can provide some insight.
The Accumulated Winter Season Severity Index – AWSSI – uses temperature, snowfall, and snow depth observations to monitor winter severity accumulated throughout the season (Boustead et al. 2015). While they find that warming temperatures result in overall decreasing trends in historic accumulations of AWSSI, we find no significant trends in winter severity at eastern Colorado stations (Fig 4.10). Large accumulating snow events can still occur frequently across the Front Range Urban Corridor and Eastern Plains. For example, the largest annual 2-day snow events since 1951 exhibit high variability with minimal detectable trends (Fig 4.10). The number of 2-day events that exceed 3 inches may be decreasing slightly, with Denver observing a decreased frequency in seasons with more than 10 events since 2000. However, Fort Collins continues to experience between 10 and 15 of these events each year.
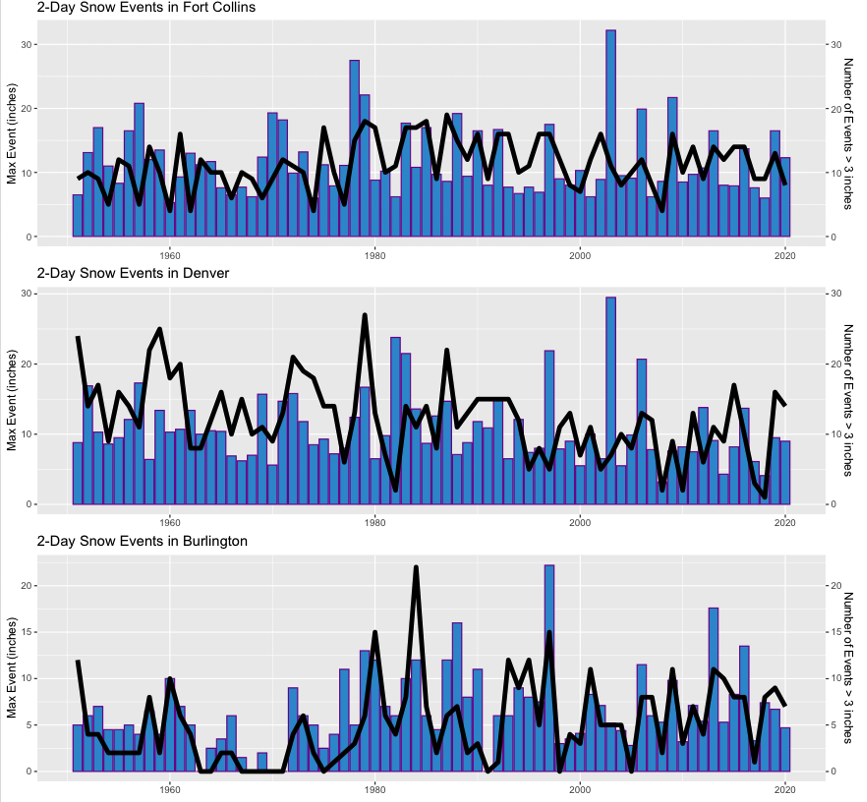
Figure 4.10
Maximum 2-day snow event per year in inches (blue bar) and total number of 2-day snow accumulations greater than 3 inches per year (black line) for Fort Collins (top), Denver Central-Park (middle), and Burlington (bottom), 1951-2020.
Several recent notable winter storms have impacted Colorado’s Front Range and Eastern Plains. A heavy snowstorm over southeastern Colorado in late April 2017 covered and killed hundreds of livestock. A ‘bomb cyclone’ passed over southeastern Colorado in March 2019, bringing destructive winds (Colorado Springs airport reported a 96-mph wind gust), snow, and low visibility across eastern Colorado. In March 2021, 20-30” of widespread snow blanketed northern Colorado. In December 2022, a powerful cold front moved across the region; the temperature in Fort Collins fell 37°F in 20 minutes, to 6°F. These events indicate that Colorado’s susceptibility to severe winter storms remains.
Over the past 20 years, the phenomenon of dust-on-snow deposition in Colorado and the West has shifted from a periodic curiosity to a chronic concern for water managers and water users. This shift is due to both a much better understanding of the significant hydrologic effects of dust-on-snow, and an overall increase in the occurrence of dust-on-snow events. Dust-on-snow is also unusual in that the visual appearance is an accurate gauge of the eventual impact on snowpack and runoff; the darker the snow surface, the stronger the dust’s radiative forcing (i.e., enhancing the sun’s energy) on snowmelt.
Dust-deposition events in Colorado typically occur during large-scale storms that move in from the southwest, most frequently in the spring (Painter et al. 2018). Strong winds in these storms pick up fine soil particles in the Colorado Plateau from lands that have been disturbed by grazing, oil and gas drilling, dryland agriculture, and off-road vehicle use (Duniway et al. 2019). Dust deposition on snowpacks and its impacts, are usually greatest in the San Juans, closest to this primary source (Painter et al. 2012; Skiles et al. 2015). Yet, the dust may be transported hundreds of miles to all of Colorado’s mountains, including the east slope of the Front Range. The dust layers from each event are often buried by subsequent snows, but then reemerge and coalesce at the snow surface as the snowpack compacts and melts down in late spring.
Lake-sediment cores from the San Juans show a several-fold increase in dust deposition starting in the mid-1800s through the 20th century (Neff et al. 2008). Dust mobility and deposition increased again around 2000, due to increasing aridity in the source areas and more widespread disturbance of the soils (Brahney et al. 2013).
Multiple studies have shown that dust loading in the snowpack alters the energy balance of snowmelt, enhances melt rates, and advances the timing of spring runoff by up to 3-6 weeks (Painter et al. 2018; Skiles et al. 2015; Painter et al. 2010; Deems et al. 2013). Modeling studies suggest that dust-on-snow deposition over the 20th and early 21st centuries has reduced natural streamflows from the Upper Colorado River Basin by about 5%, or 800,000 acre-feet, compared to pre-1800s low-dust conditions (Painter et al. 2010). This is mainly due to earlier meltout of snowpacks and increased evapotranspiration from soils and vegetation that are exposed and growing earlier in the season.
In a warmer future climate, overall drier soil conditions in the dust source region are very likely, which will tend to reduce vegetation cover and allow for greater dust emission, given the same level of disturbance (Munson et al. 2011). Further warming, like dust-on-snow, will tend to drive even earlier snowmelt and runoff. The only study to jointly model dust-on-snow and warming found that runoff timing remains strongly affected by dust under a variety of future warming scenarios (Deems et al. 2013). However, in a significantly warmer mid-century climate, going from “moderate” dust to “extreme” dust has no additional effect on runoff volume.
With the increase in the area burned annually by wildfires in the 21st century, attention to the issue of flash flooding and debris flows in burned areas has also increased. When the landscape is burned by wildfire, especially by a high-intensity fire, the soil often becomes hydrophobic, instead of being able to soak up rainwater (NOAA 2023b). As such, flash floods and debris flows can develop in recently burned areas with much less rainfall than would be needed in non-burned areas. For example, a rain rate of 0.25” in 15 minutes is used as a general guideline for the potential of flash flooding on a burn scar, whereas such rain rates would be very unlikely to produce flash flooding in non-burned areas (COMET MetEd).
While burn-scar flash flooding occurred after the large wildfire seasons in 2002, 2012, and 2018, the concerns became particularly acute after the record 2020 fire year. Several major floods and debris flows occurred in the summer of 2021. In the Poudre Canyon in northern Colorado, intense rain fell on the Cameron Peak burn scar on the evening July 21, and a devastating flash flood occurred, killing four people and destroying several homes (Whitehead 2021). Again in 2022, heavy rain on the Cameron Peak burn scar resulted in a deadly flash flood when a camper was washed away in Buckhorn Canyon (Tabachnik 2022).
Farther south, the Grizzly Creek burn scar was the site of numerous debris flows following intense monsoon rains in July 2021. The largest of these occurred on July 31, when Interstate 70 in Glenwood Canyon was overtopped with debris and heavily damaged. The important western Colorado highway was closed for over two weeks for repairs (Nicholson 2021).
As discussed in section 4.4, area burned by wildfires has increased in the 21st century in Colorado and is expected to increase further in a warming climate. Although trends in extreme rainfall have not yet been robustly detected in Colorado, it is expected that the heaviest rain rates will generally increase as the climate continues to warm (see section 4.5 on extreme rainfall). Even if extreme precipitation remains unchanged, an increase in burned area increases the risk of burn-scar flooding during the intense thunderstorms that have regularly been observed historically. Then, if short-term rain rates also increase, the frequency and intensity of compound flood-after-fire hazards will increase significantly. Touma et al. (2021) projected large increases in future extreme rain events occurring within one year of intense wildfires in the western U.S. Although their results were for a high-emissions scenario, even more modest increases in each individual hazard (i.e., with less extreme future emissions) would lead to much higher future risk for these compound events.
There are several different air quality issues that impact Colorado. Each may exhibit varying trends around the state. While most air quality issues are anthropogenic (with the exception of smoke from naturally caused wildfires), they may or may not be influenced by climate change. The primary issues that may be impacted by climate change are discussed below.
Traffic, industry, oil and natural gas production, and wildfire smoke can all contribute to ozone formation and abundance in the state. Currently, the Northern Front Range exceeds the ozone National Ambient Air Quality Standard (Bien and Helmig 2018), and despite decreasing ozone in other areas of the country, some Northern Front Range sites have exhibited increases in ozone between 2000 and 2015 (Abeleira and Farmer 2017). While it is essential to reduce precursor emissions, ozone’s tempera- ture dependence (warmer temperatures increase ozone) means climate change will exacerbate the issue (Crooks et al. 2022).
During the summer, the largest smoke-plume source regions are located in the Western U.S. and Rocky Mountains (Brey et al. 2018). More local wildfire smoke (which will have a more significant impact on Colorado from Rocky Mountain wildfires) tends to stay lower in altitude and have higher PM2.5 concentrations. As noted in the Wildfire section, wildfire activity (both acres burned and number of fires) is expected to increase with climate change. It is likely that air quality in Colorado (particularly in the summer) will subsequently continue to degrade.