April 1 SWE (snow-water equivalent) during the 21st century has been 3% to 23% lower
than the 1951-2000 average across Colorado’s major river basins.
Future warming will lead to further reductions in Colorado’s spring snowpack. Most
climate model projections of April 1 SWE in the state’s major river basins show
reductions of -5% to -30% for 2050 compared to 1971-2000; the individual projections that
show increasing snowpack assume large increases in fall-winter-spring precipitation.
The seasonal peak of the snowpack is projected to shift earlier by a few days to
several weeks by 2050, depending on the amount of warming and the precipitation change.
This warming-driven shift could be accelerated by increases in dust-on-snow events.
Streamflow
Since 2000, annual streamflow in all of Colorado major river basins has been 3% to
19% lower than the 1951-2000 average.
Modeling studies have attributed up to half of the observed decrease in streamflow
since 1980 in Colorado river basins to warming temperatures.
Future warming will act to reduce annual streamflows. Most climate model projections
of annual streamflows in the state’s major river basins for 2050 show reductions of 5%
to 30% compared to 1971-2000.
Higher future streamflow would require large overall increases in precipitation to
offset the effects of warming, an outcome that appears unlikely.
Summer and fall streamflows are projected to decline significantly by 2050 as the
seasonal runoff peak shifts earlier, by 1-4 weeks, due to warming.
Soil Moisture
Modeled soil moisture based on meteorological observations suggests overall declines
in high-elevation soil moisture from 1980-2022.
Future warming will lead to declines in summer (June-August) soil moisture throughout
the state. Spring (March-May) soil moisture will likely increase at higher elevations as
snowmelt shifts earlier.
Rapid depletion of soil moisture under warm conditions exacerbates warming. When
summer sunshine hits a landscape with dry soil a greater fraction of solar energy directly
heats the surface, leading to even warmer conditions.
Evapotranspiration
The evaporative demand (“thirst”) of the atmosphere — as measured by potential
evapotranspiration (PET) and Reference ET — has increased across Colorado since 1980,
mainly due to the warming trend. Statewide, growing-season PET increased by 5% from
1980-2022.
Additional future warming will drive greater evaporative demand; all climate model
projections show statewide annual PET increasing by 8-17% by 2050, compared to 1971-2000.
3.1 Overview
Colorado is known as a ‘headwaters’ state because four major river systems have most of
their mountain headwaters within its borders: the Colorado River, the Rio Grande, the
Arkansas River, and the Platte River. All of these major rivers, and all of their
tributaries with headwaters above 8,000 feet, have a snowmelt-dominated hydrology: most
of their annual streamflow (~60-80%) originates as meltwater from the seasonal snowpack
(Li et al. 2017).
Streams whose watersheds are entirely at lower elevations, whether on
the eastern plains or in the western plateau region, have flows driven more by rainfall
in the warmer months, with less contribution from snowfall and snowmelt.
Most of the water use in Colorado (83%) depends on surface water supply from streams and
rivers, often stored in reservoirs (CWCB 2023).
The remaining 17% of water supply comes
from groundwater wells that tap either alluvial aquifers that are strongly connected to a
river or stream, or deeper aquifers that are replenished over much longer time periods.
In this chapter, we describe recent trends and likely future changes in four related
dimensions of Colorado’s water resources: snowpack, streamflow, soil moisture, and
evapotranspiration. To summarize observed trends, we rely on both recent research studies
and new analyses using observations from key datasets. For likely future changes, we rely
on recent studies and new analyses using the ensemble of CMIP5-LOCA-VIC hydrologic
projections (Vano et al. 2020).
See Appendix A for more information about these hydrologic
projections.
3.2 Snowpack
Overview
Colorado’s snowpack serves as a huge seasonal reservoir that stores about 15 million
acre-feet of water on average at the spring peak and then makes that water available
later in the year when water demands for agricultural uses and outdoor watering are
higher. Precipitation that falls and is stored as snow is also more likely to end up as
runoff than precipitation that falls as rain (Li et al. 2017).
Colorado’s seasonal
snowpack begins accumulating in late fall and typically peaks in April or May. Once
rising spring temperatures warm all of the snowpack to 32°F (0°C), the sun’s energy can
more effectively drive snowmelt. The snowmelt leads to an abrupt peak in streamflow,
typically in May or June. On most streams and rivers in Colorado fed by mountain snowmelt,
about 70-80% of the annual runoff comes in the four months from April to July.
Snow-water equivalent (SWE) refers to the amount of liquid water that would result if the
snowpack were melted down. SWE is a better measure for hydrologic monitoring than total
snowfall or snow depth, since the latter measures don’t account for the highly variable
density of snow. The amount of SWE around the seasonal peak (usually April 1 to May 15)
is a very useful predictor of the spring and summer runoff. The peak SWE in Colorado’s
mountains is typically 10” to 50”, depending on location, elevation, and year. Note that
the snow and rain that falls after peak SWE (in April, May, and June) can dramatically
shift the runoff outcomes in years with anomalous spring precipitation, such as 2020 (low)
and 2015 (high). In Colorado, SWE is measured hourly at 114 automated SNOTEL (SNowpack
TELemetry) sites, and monthly at 81 snow courses, all maintained by the Natural Resources
Conservation Service (NRCS) Colorado Snow Survey and its cooperators. Nearly all of these
SNOTEL and snow course sites are between 8,500’ and 11,500’.
Similar to weather station data, snow data are subject to non-climatic influences
(especially changes in vegetation over time, such as beetle-kill or wildfire) that affect
snow deposition at the site (Kampf et al. 2022;
Julander and Bricco 2006;
Pugh and Small 2012;
Giovando and Niemann 2022).
Thus, monitoring and trend analysis based on multiple
sites is more representative of basin-wide conditions compared to single site monitoring
and analysis.
Observed snowpack changes
Several recent studies have documented widespread declining trends in April 1 SWE across
the West over the past 40 to 70 years (Fyfe et al. 2017;
Mote et al. 2018;
Zeng et al. 2018;
Siler et al. 2019;
Musselman et al. 2021).
These studies showed
that SWE has decreased in most sites in Colorado’s major river basins, though the percentage
declines in SWE in Colorado were generally smaller than in most other regions of the West
due to Colorado’s relatively high elevations and colder winter climate. These studies also
found that warming temperatures were an important cause of the observed SWE declines,
while below-normal fall and spring precipitation in the past few decades has also played a
role.
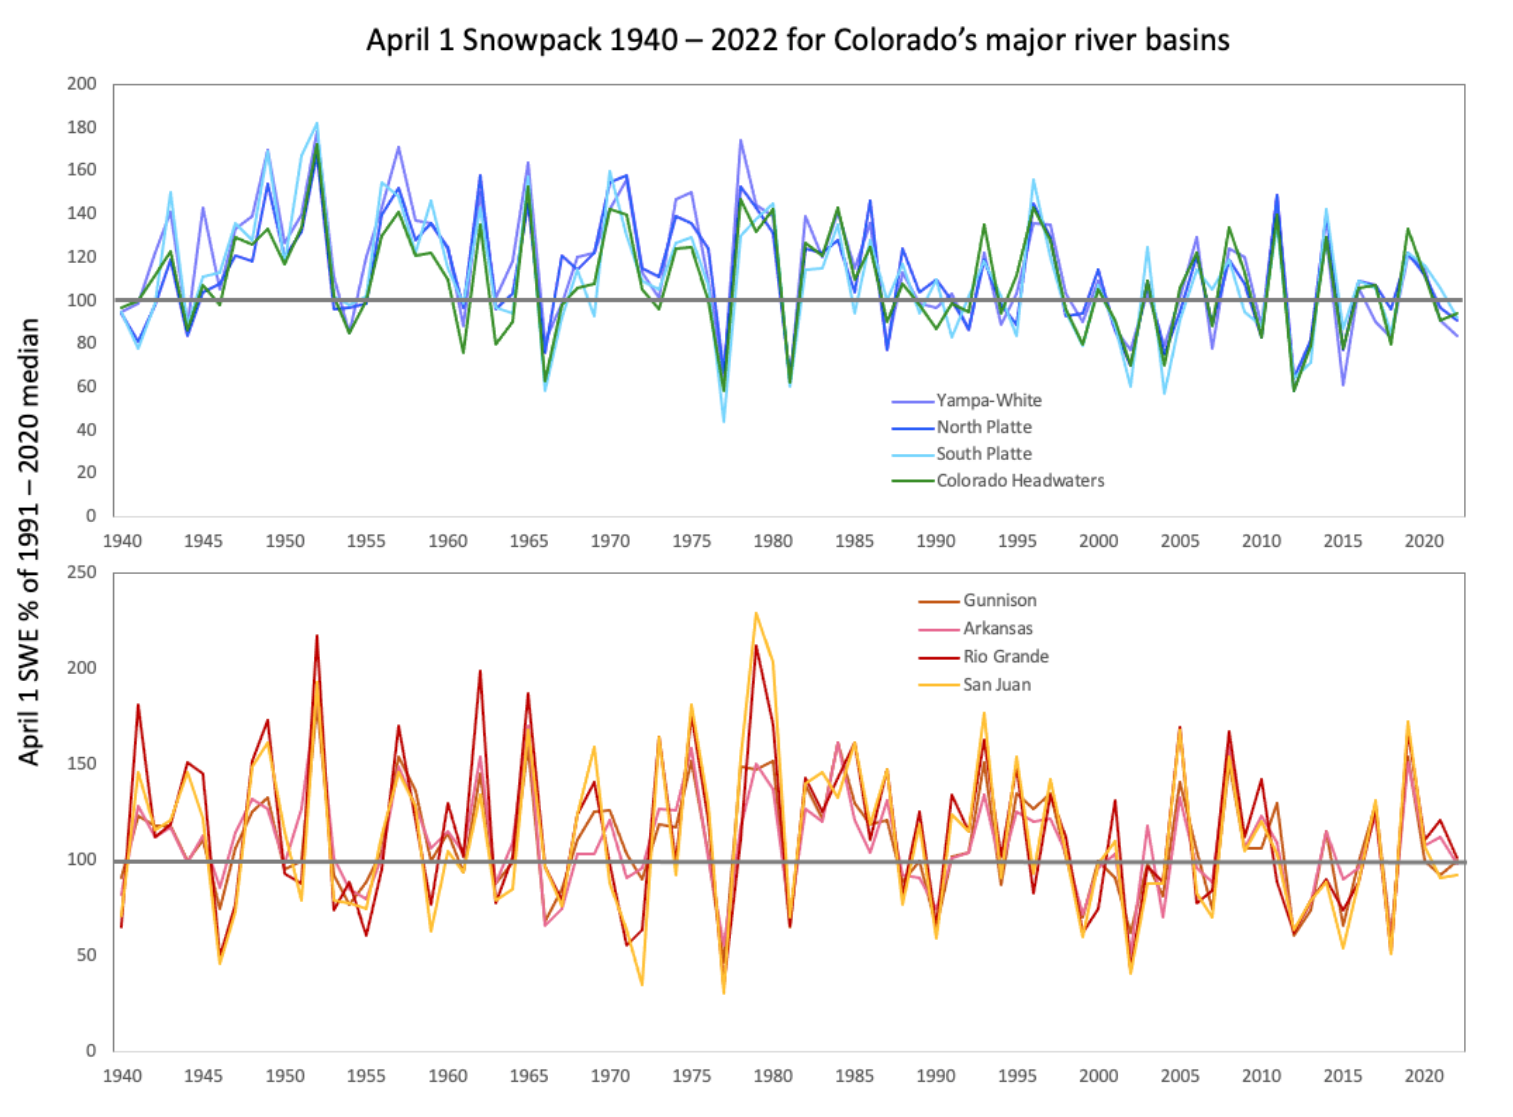
An analysis of Colorado’s snowpack updated from the 2014 report is consistent with these
recent West-wide studies. Figure 3.1 shows basin-wide SWE from SNOTEL sites and snow
courses starting in the 1940s to 1960s for eight of Colorado’s river basins. Note that
the year-to-year variability, especially drought years, is highly correlated among the
basins. The 21st century (2001-2022) average April 1 SWE for all eight basins is lower,
by 3% to 23%, than the 1951-2000 average (Figure 3.1). The largest decreases occurred in
the southwestern portion of the state, specifically in the San Juan and Rio Grande basins.
Figure 3.1 shows that years with very large snowpacks (>140% of median) — important for
refilling reservoirs — have been less frequent since the 1980s. Though as 2019 demonstrates,
these big snowpacks can still occur.
Figure 3.1
Observed April 1 snow water equivalent for northern basins (top) and southern basins (bottom) compared to 1991-2020 median.
Many previous studies have used climate projections (Chapter 2) in combination with
hydrologic models to simulate future changes in the hydrology of river basins in Colorado
and elsewhere in the interior West. They show that April 1 SWE is likely to decline
across Colorado’s river basins due to the systemic impacts of warming temperatures,
despite the projected increases in winter and spring precipitation (Battaglin et al. 2011;
Lukas et al. 2014;
Lute et al. 2015;
Alder and Hostetler 2015;
Lukas et al. 2020b;
Reclamation 2021).
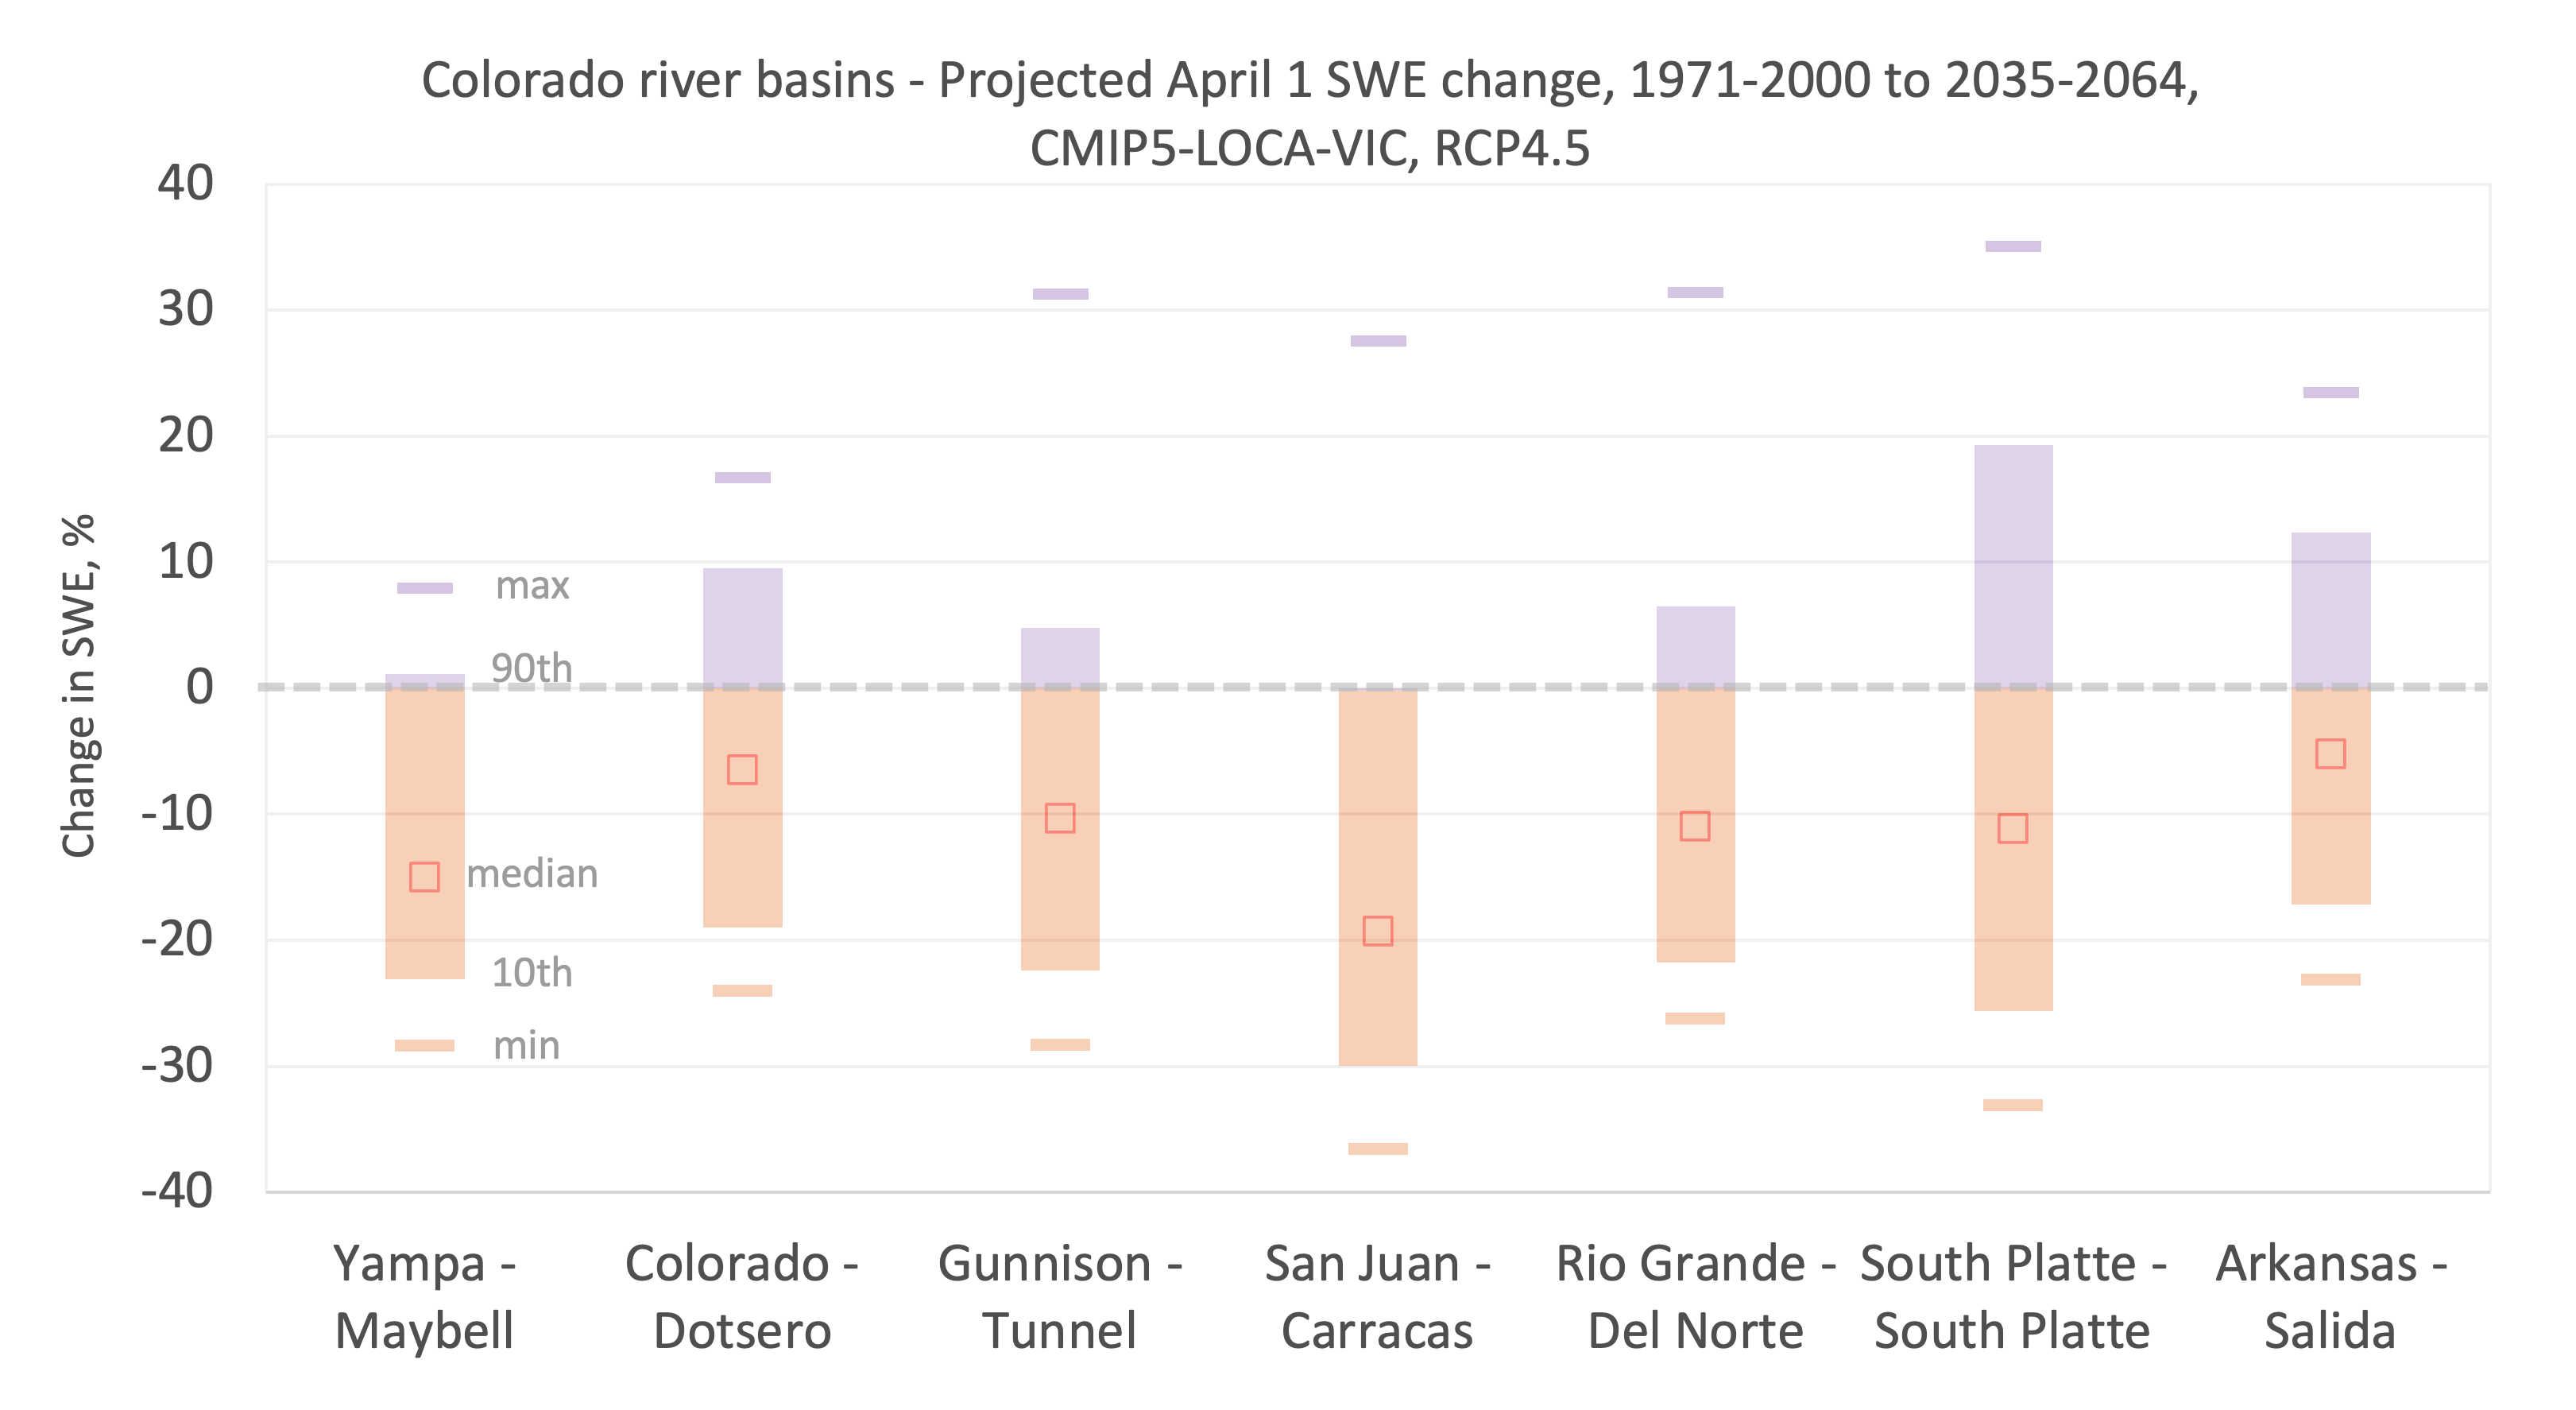
For this report, we analyzed the CMIP5-LOCA-VIC hydrologic projections as noted in
Section 3.1. Figure 3.2 shows the projected change in April 1 SWE, under RCP4.5, between
the historical baseline (1971-2000) and the 2050-centered period (2035-2064) for the
watersheds above key gages within seven major Colorado river basins. In all of the
basins, most projections indicate decreased April 1 SWE in the 2050-centered period.
Figure 3.2
Projected future change in April 1st snow-water equivalent (SWE) in watersheds above key
gages in seven Colorado river basins for a 2050-centered period (2035-2064) relative to
1971-2000, from an ensemble of 32 CMIP5-LOCA-VIC hydrology projections under a medium-low
emissions scenario (RCP4.5). The solid purple and red bars show the middle 80% of the
projections (10th-90th percentiles); the two dashes show the minimum and maximum
projections; the open squares show the median projections. (Data: GDO-DCP, https://gdo-dcp.ucllnl.org/).
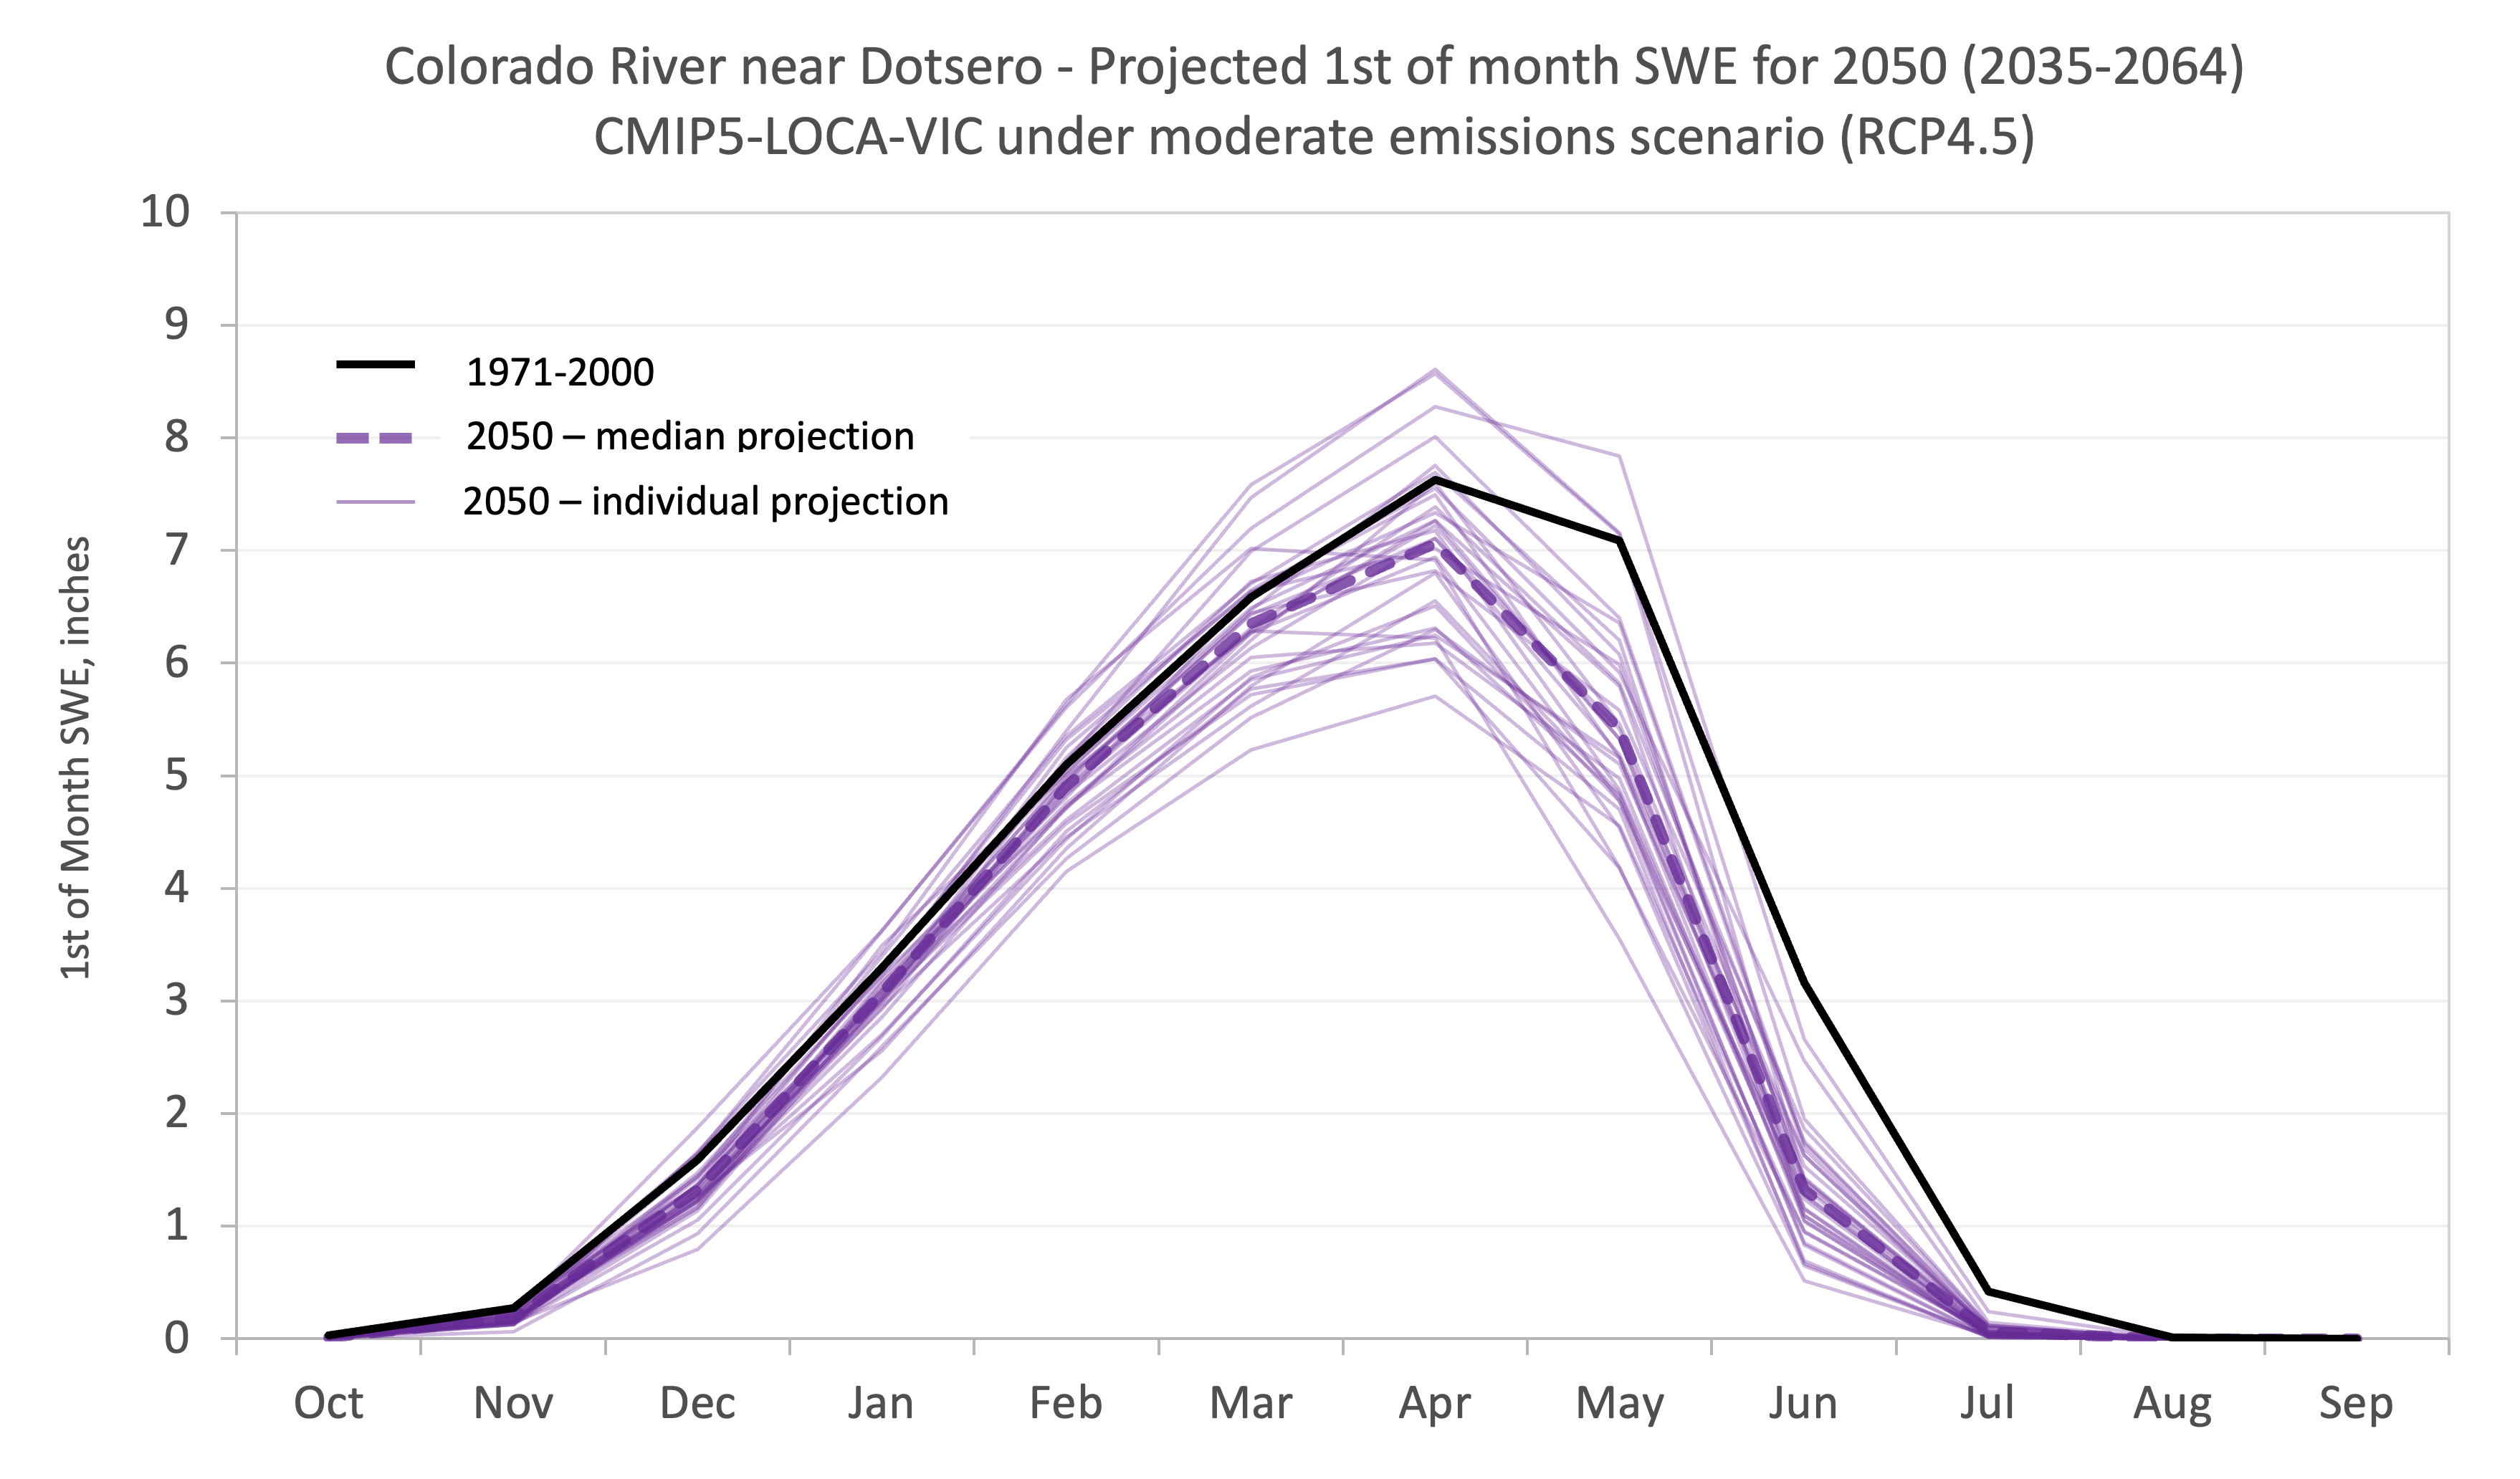
While April 1 SWE is a very commonly used indicator of snowpack and a good predictor of
April-July streamflow, it is also a single snapshot in time. Figure 3.3 shows the
projected monthly SWE, under RCP4.5, for the 2050-centered period (2035-2064) compared
with the historical baseline (1971-2000) for the watershed above the Colorado at Dotsero
gage. From November to April, most of the projections for 2050 show lower first-of-month
SWE than the historical baseline, reflecting reductions in snow accumulation due mainly
to warmer temperatures. For May 1, nearly all projections for 2050 show lower SWE than
the historical baseline; the decreases in SWE are greater for April 1. This indicates
that snowmelt is starting earlier in the future period. For June 1, all 32 projections
show lower SWE than the historical baseline, including projections that showed increased
SWE on April 1.
Figure 3.3
Projected future 1st-of-month snow-water equivalent (SWE) for the basin above the Colorado
River at Dotsero gage for a 2050-centered period (2035-2064) from an ensemble of 32
CMIP5-LOCA-VIC hydrology projections (purple) under a medium-low emissions scenario
(RCP4.5), and the simulated mean monthly SWE for the 1971-2000 period (black). The
plotted monthly values are for the 1st of the month. (Data: GDO-DCP, https://gdo-dcp.ucllnl.org/)
Examination of the daily data underlying Figure 3.3 shows that the seasonal peak SWE
during the 1971-2000 historical period occurred, on average, on April 9. For the
2050-centered period, 27 of the 32 projections indicate seasonal peak SWE occurring
earlier than April 9, by as much as 38 days. The median projection suggests peak SWE
will occur 11 days earlier, on March 29.
3.3 Streamflow
Overview
The high mountains of Colorado form the headwaters of major rivers and their tributaries
that provide water supply for Colorado and over two dozen downstream states and Mexico,
including the Colorado, Rio Grande, Arkansas, and North and South Platte rivers. Water
from the Colorado River alone is relied upon by over 40 million people. Accurate
forecasts of the volume and timing of streamflow are crucial on a daily-to-annual basis
for reservoir managers, irrigators, municipal water providers, and flood-warning systems.
Similarly, understanding historical variability in streamflow and any potential future
changes in streamflow is critical to long-term water planning.
As discussed in the previous section, seasonal (e.g., April-July) and annual streamflows
in most of the state’s streams and rivers are driven by snowmelt, so the year-to-year
variability in surface water supply in Colorado is strongly related to the variability
in the snowpack (e.g., April 1 SWE). Accordingly, seasonal and annual streamflow can be
skillfully (though not perfectly) predicted 1-5 months ahead of peak runoff, primarily
using SWE and precipitation data. However, precipitation that falls before the start of
the snowpack season and after the seasonal SWE peak contributes to runoff as well. The
largest source of uncertainty in streamflow forecasts made between January and May is
how the subsequent weather will evolve.
The large magnitude of interannual streamflow variability is an ongoing challenge for
water managers. As seen in figure 3.4, water year streamflows in Colorado’s river basins
vary by up to six-fold from year to year - more than the relative variability in
precipitation and snowpack. This is because the fraction of precipitation and snowpack
lost to evapotranspiration (see later in this chapter) is greater than average in dry
years and less than average in wet years, magnifying the difference in runoff outcomes
between dry and wet years. For example, a basin snowpack that is 90% of normal will tend
to produce streamflows that are only around 80% of normal (Vano et al. 2012).
Observed Streamflow Changes
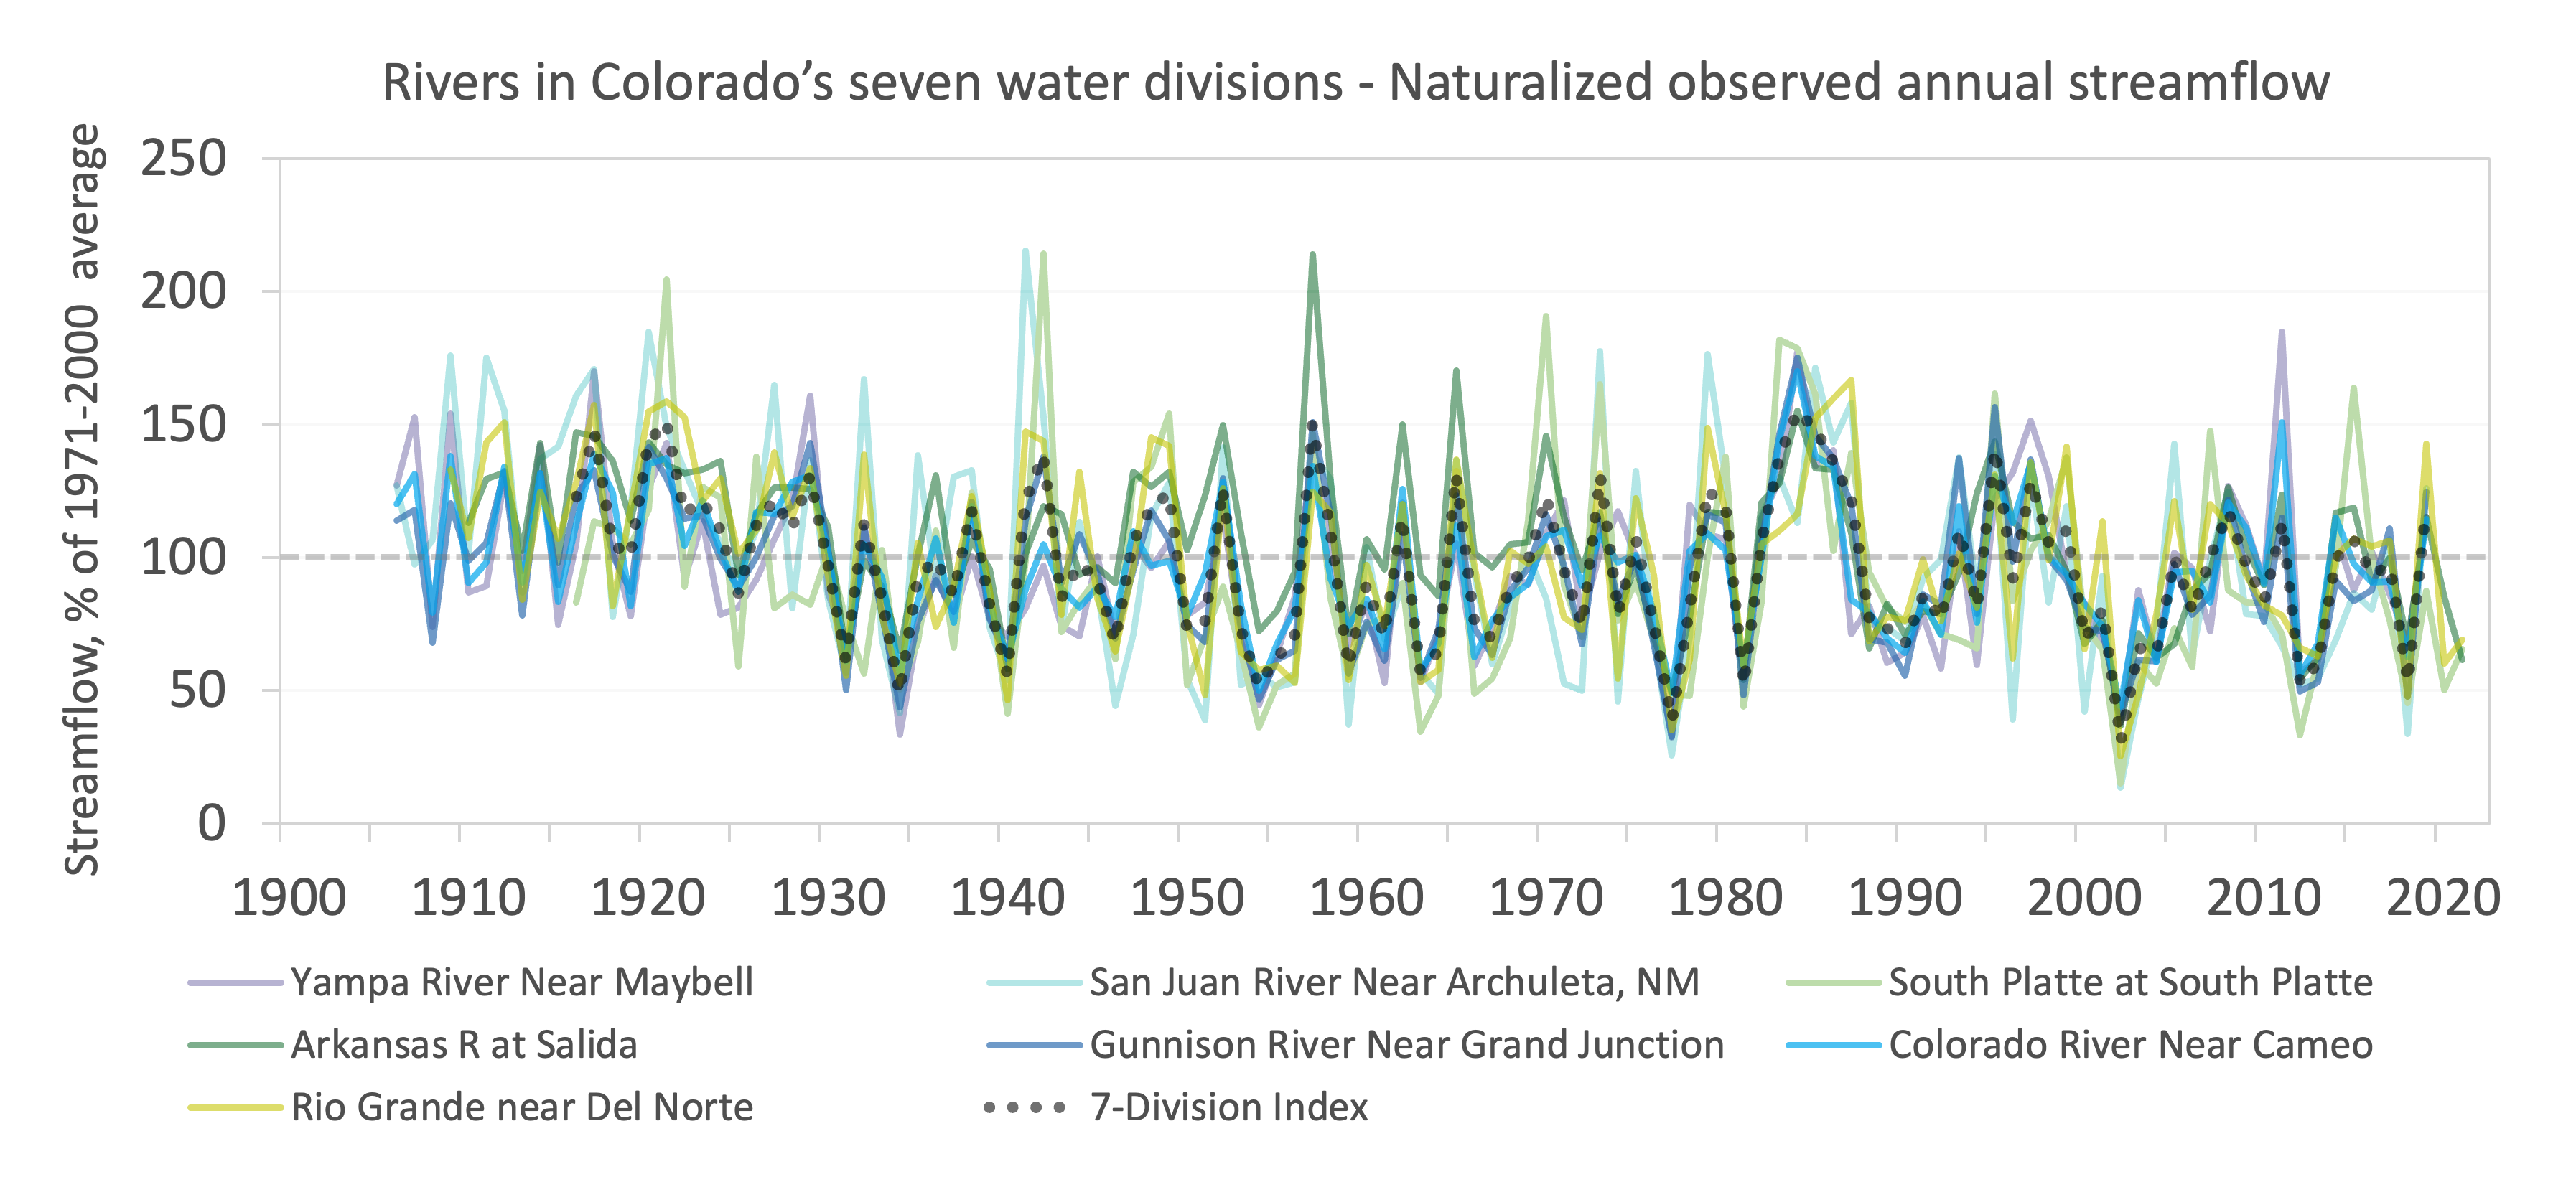
Since 2000, the average annual naturalized streamflows in all of Colorado’s major river
basins have been lower than the 1951-2000 period (Figure 3.4). Naturalized streamflows
are gaged streamflows that have been corrected for upstream diversions, depletions, and
reservoir operations, making them more appropriate for monitoring long-term change.
The largest relative reductions in flow have been seen in the Arkansas (-19%), South
Platte (-18%), San Juan (-15%), and Gunnison (-13%), with smaller reductions in the Yampa
(-3%), Colorado headwaters (-5%), and Rio Grande headwaters (-8%). A growing body of
evidence indicates that the recent lower streamflows in Colorado have been driven not just
by below-normal precipitation, but also by anthropogenic warming
(Udall and Overpeck 2017;
McCabe et al. 2017;
Xiao et al. 2018;
Hoerling et al. 2019;
Albano et al. 2022;
Milly and Dunne 2020).
While most of these studies have focused on the Upper
Colorado River Basin (i.e., Yampa, Colorado, Gunnison, San Juan) the general findings are
applicable to Colorado’s other river basins. The rough consensus that emerges from these
studies is that 20-50% of the observed reduction in streamflows since 2000 has been due
to warmer temperatures. As discussed in Chapter 2, anthropogenic atmospheric changes may
also have some role in the reduced precipitation since 2000, alongside natural variability.
Figure 3.4
Observed naturalized annual (water-year) streamflows for key gages in seven river basins,
one from each of Colorado’s water division, from the early 1900s through 2019 or 2021,
depending on the gage. The gage records have been corrected for upstream diversions and
depletions to reflect the natural hydrology of the watershed. (Data sources: Yampa, Gunnison, San Juan,
Colorado: Reclamation; South Platte: Denver Water; Rio Grande: CO DWR; Arkansas: J. Lukas
based on Hydrosphere/Aurora Water)
As Colorado’s climate continues to warm over the next several decades (Chapter 2), the
warmer temperatures will have increasing systemic impacts on the hydrologic cycle. Given
the same amount of precipitation, annual runoff will be lower in a warmer climate—an
effect that is already occurring as described above. It is uncertain how much Colorado’s
climate will warm (Chapter 2), and it is not precisely known how sensitive the streamflow
in Colorado’s river basins is to each increment of warming. However, the science is
clear: further warming alone will push the water cycle towards reductions in streamflow
and water supply.
Due to the pervasive impacts of warming, most of the plausible climate and hydrologic
futures for Colorado’s river basins show decreasing annual runoff. Increases in runoff
will occur only if there is a large future increase in precipitation. This general
finding has been seen across many studies, using different sets of climate models,
different downscaling methods, and different hydrologic models
(Nash and Gleick 1991;
Christensen et al. 2004;
Christensen and Lettenmaier 2007;
Reclamation 2011;
CWCB 2012;
Woodbury et al. 2012;
Lukas et al. 2014;
Alder and Hostetler 2015;
Harding 2015;
Lukas et al. 2020b;
Reclamation 2021). In studies that have projected
future changes in streamflow for multiple basins across Colorado, besides the Colorado
River and headwaters, the overall tendency towards lower future flows is not as strong
in the northwestern basins (Yampa and White), while it is strongest in the southern
basins (San Juan, Rio Grande)
(CWCB 2012;
Lukas et al. 2014;
Harding 2015).
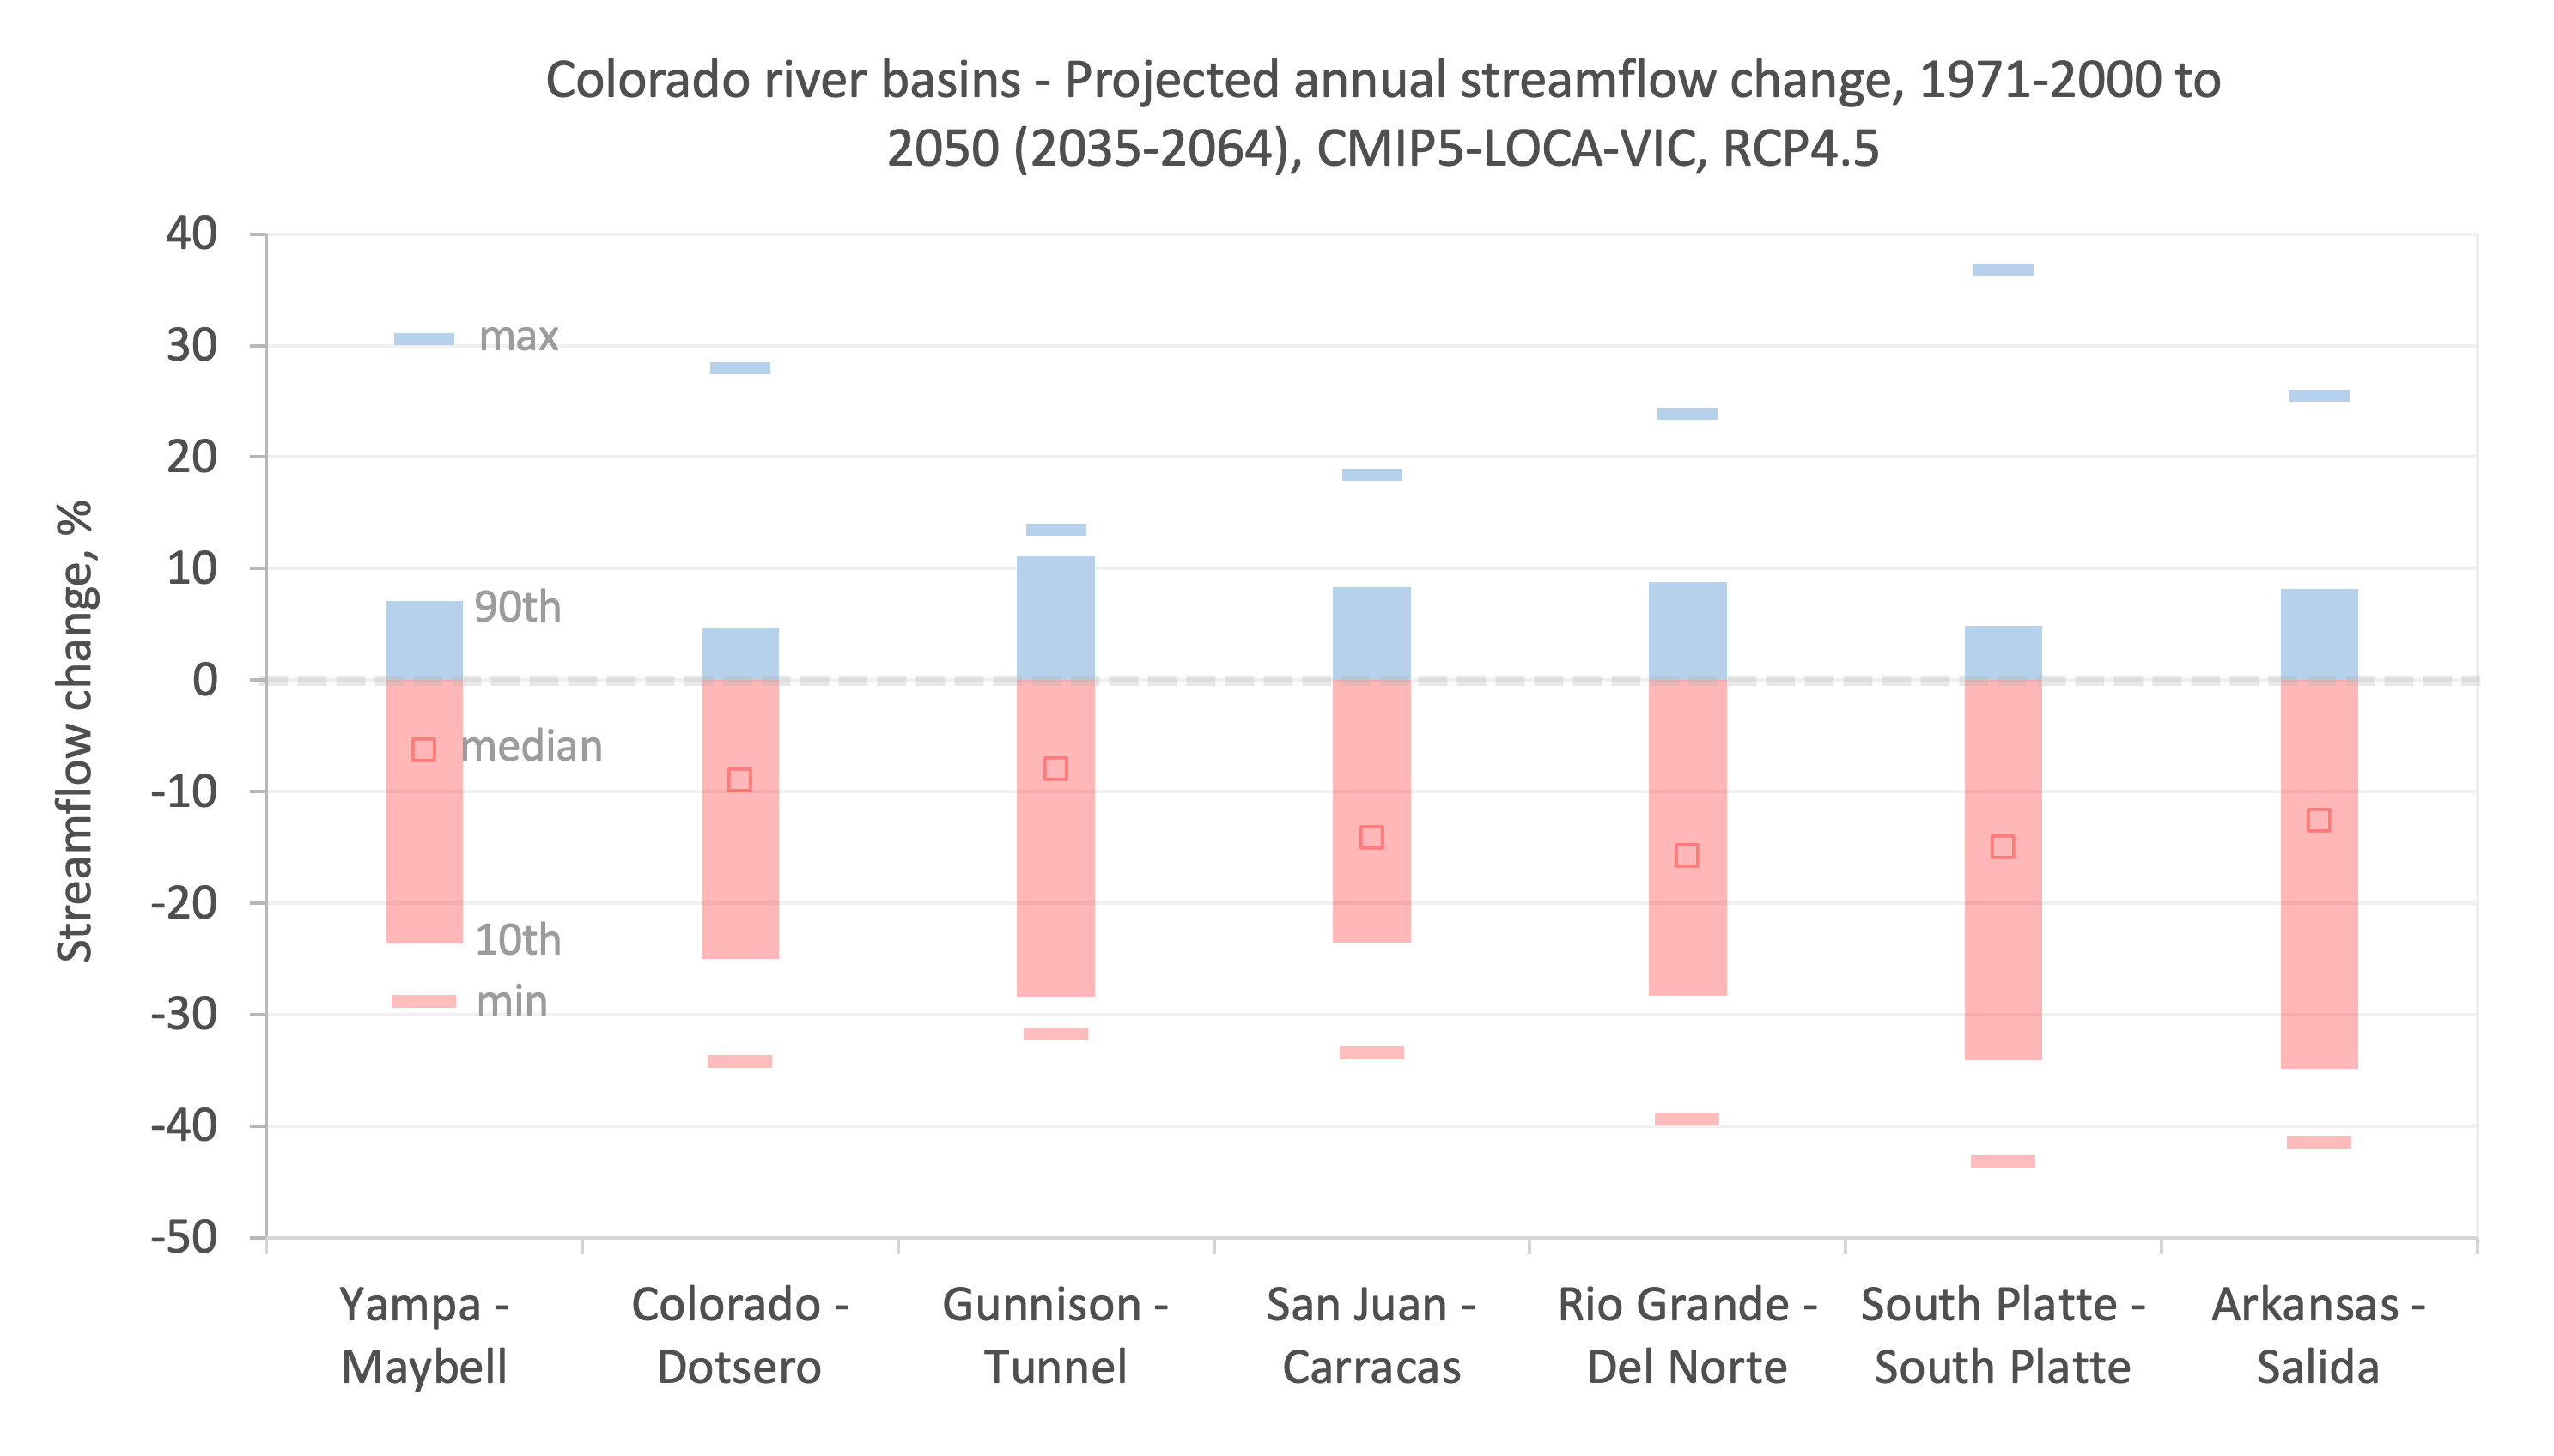
Figure 3.5 shows the projected annual streamflow change under RCP4.5 between the
historical baseline (1971-2000) and the 2050-centered period (2035-2064) for gages within
seven major Colorado river basins, based on the set the hydrologic projections
(CMIP5-LOCA-VIC) described above under future snowpack projections. In every basin, a
large majority (65-80%) of the 32 projections indicate decreased streamflow in the
2050-centered period, even though most of the underlying climate model projections show
at least slightly higher annual precipitation in the future period (Chapter 2). This
difference between the precipitation outcomes and the streamflow outcomes reflects the
impact of warming in reducing streamflow for a given amount of precipitation.
Figure 3.5
Projected future annual streamflow change for key gages in seven Colorado
river basins for a 2050-centered period (2035-2064) relative to 1971-2000, from an
ensemble of 32 CMIP5-LOCA-VIC hydrology projections under a medium-low emissions
scenario (RCP4.5). The solid blue and red bars show the middle 80% of the projections
(10th-90th percentiles); the two dashes show the minimum (red) and maximum (blue)
projections; the open squares show the median projections. (Data: GDO-DCP,
https://gdo-dcp.ucllnl.org/)
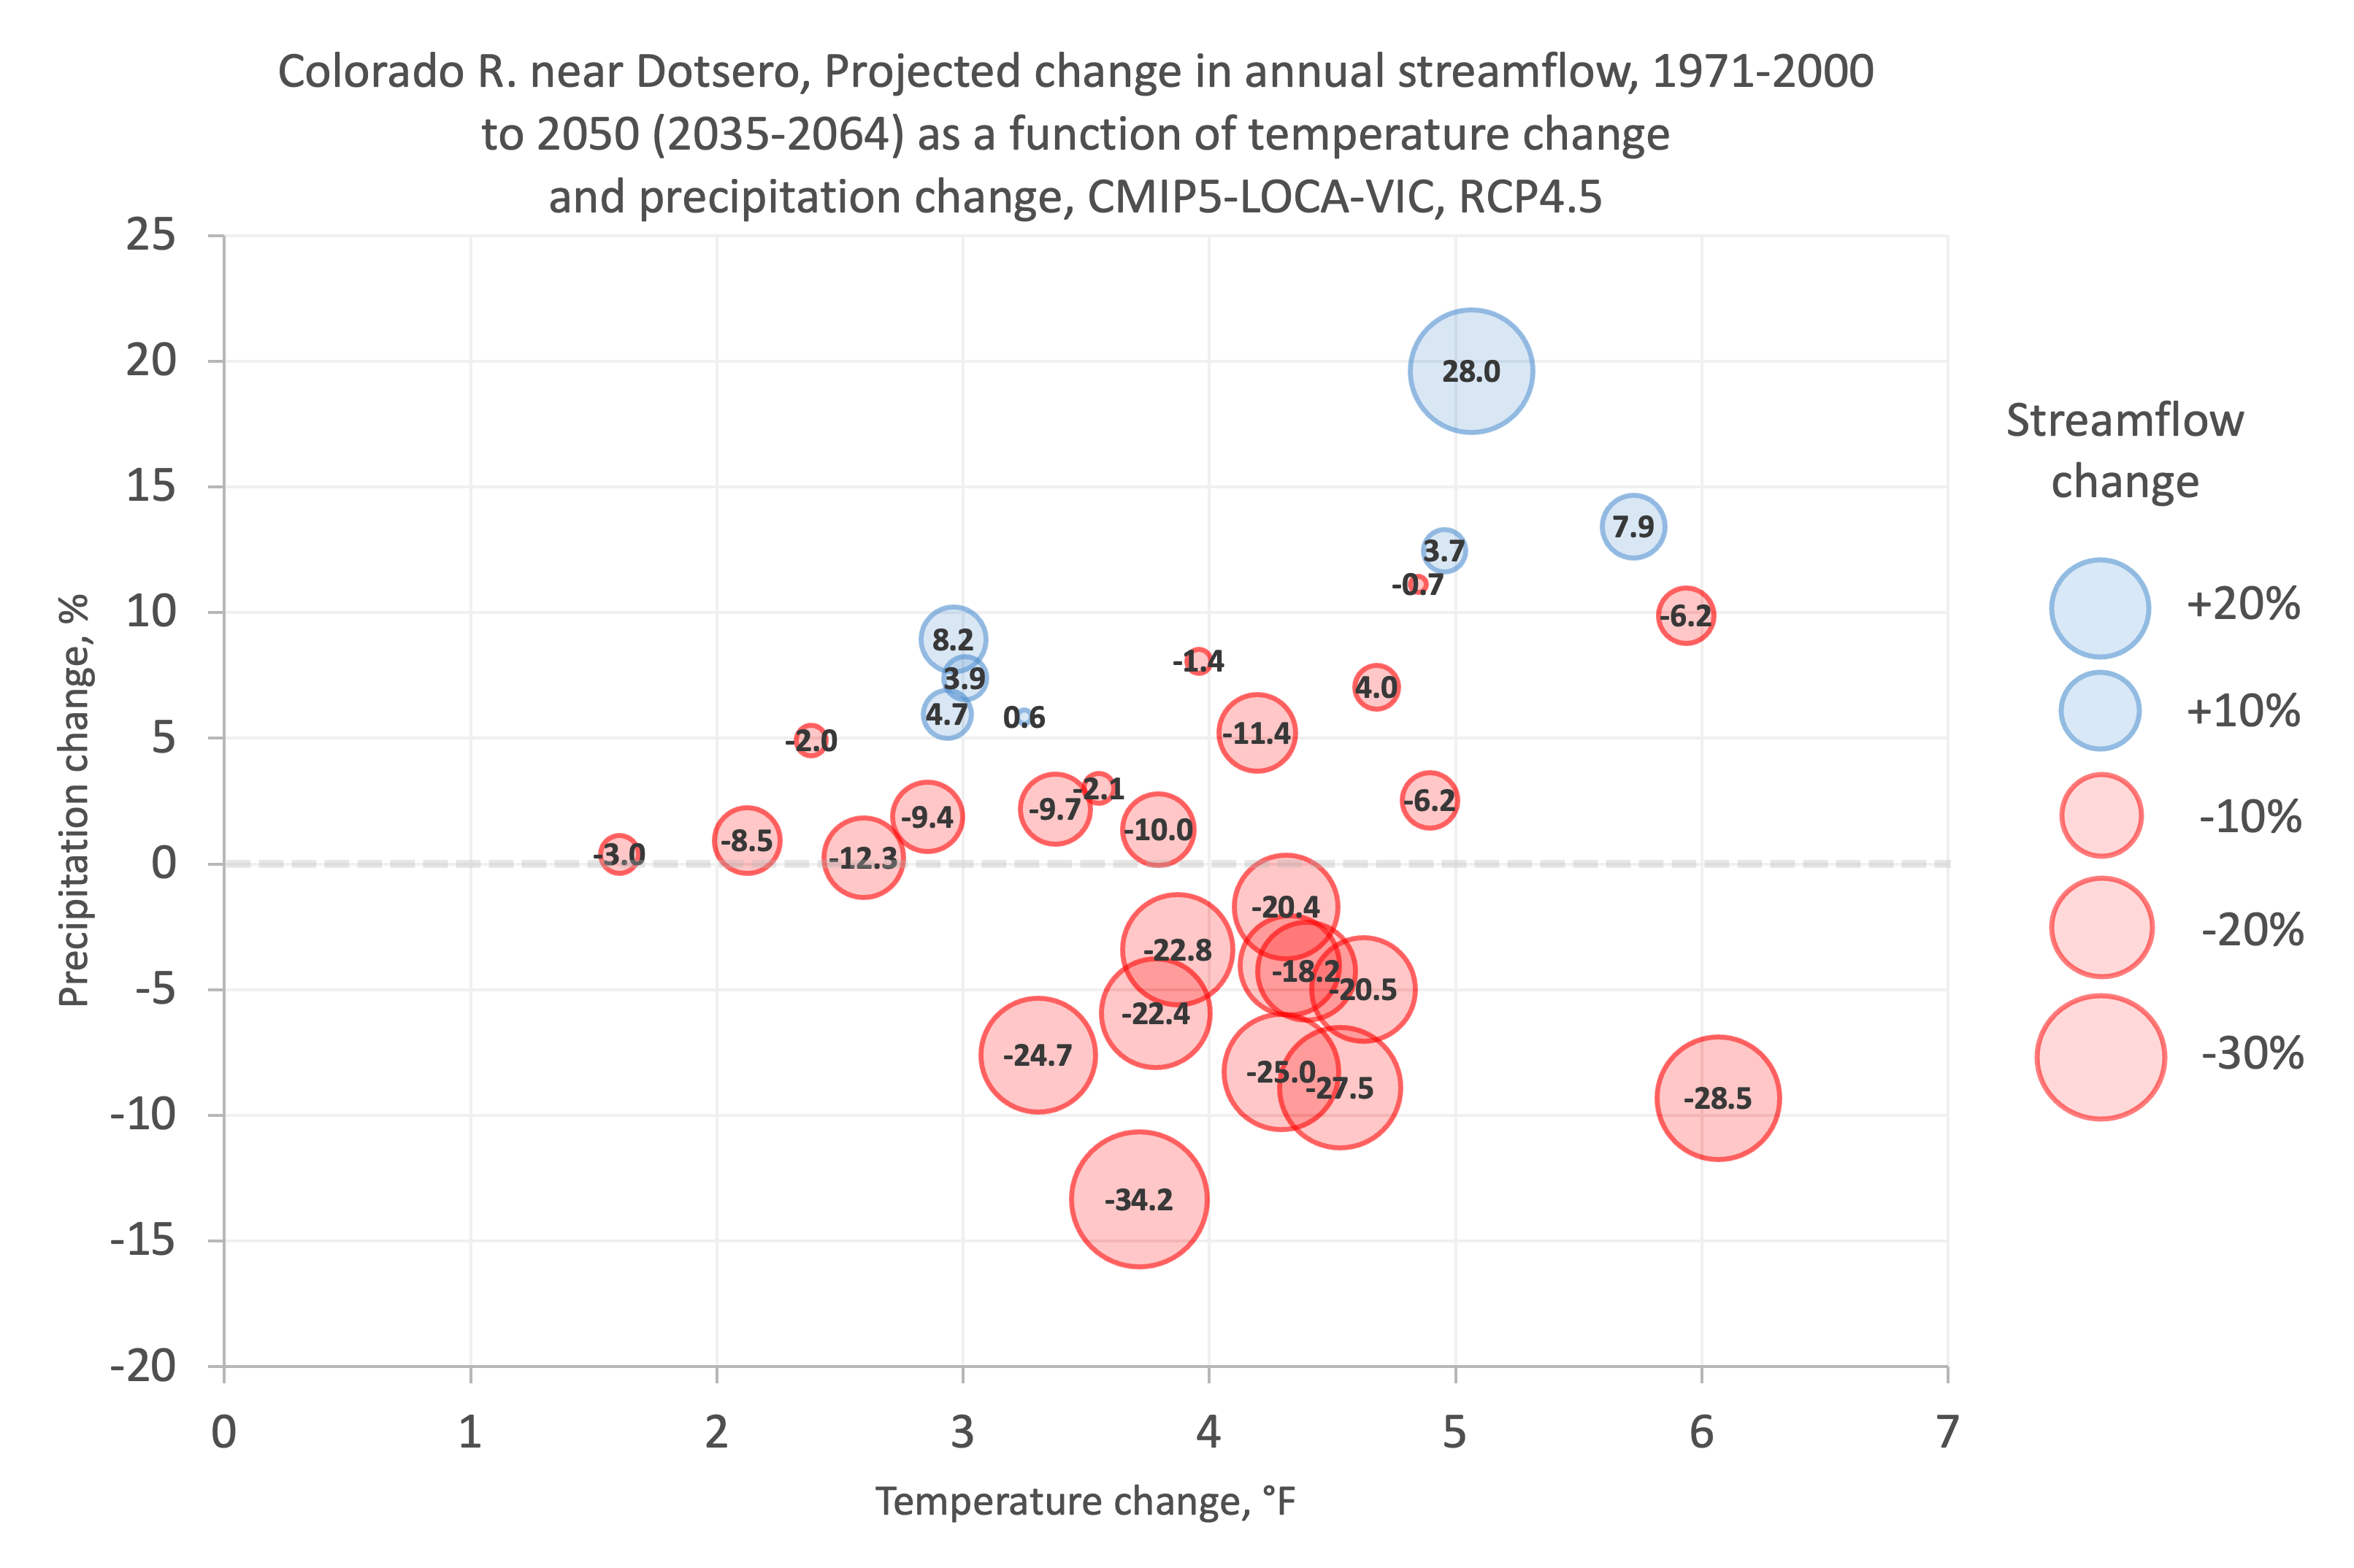
The relative impacts of warming and precipitation change on projected streamflow can be
seen in Figure 3.6, which shows the 32 CMIP5-LOCA-VIC projections of streamflow change
for the Colorado River near Dotsero as a function of that projection’s temperature
increase and precipitation change. From the statistical relationships between
streamflow change, temperature change, and precipitation change underlying this chart,
we can estimate that an ensemble-average warming (~4°F) for 2050, relative to 1971-2000,
coupled with no precipitation change would result in a streamflow decline of ~13%. Since
about 1.5°F of warming has already occurred beyond the 1971-2000 average, this implies
that a ~5% streamflow decline has already occurred, with another ~8% decline taking place
by 2050, under the 4°F overall warming scenario. These estimates are consistent with
previous studies suggesting that each 1°F increment of warming results in a streamflow
reduction of 3-5% in Colorado river basins
(Woodbury et al. 2012;
Vano and Lettenmaier 2014;
Milly and Dunne 2020). The minority of the projected climate futures that show
increased streamflow in the 2050 period (Figure 3.6; blue bubbles) are all predicated on
an increase in annual precipitation of at least 5%, enough to overcome the impacts of
warming. Previous studies have found that a precipitation change of 1% results in a
streamflow change of 2-3%
(Vano and Lettenmaier 2014), consistent with what is seen here.
Figure 3.6
Projected change (%) in annual streamflow (values inside the circles) for the Colorado
R. near Dotsero gage, as a function of the projected temperature increase (x-axis) and
precipitation change (y-axis), for a 2050-centered period (2035-2064) relative to
1971-2000, from an ensemble of 32 CMIP5-LOCA-VIC hydrology projections under a medium-low
emissions scenario (RCP4.5). (Data: GDO-DCP, https://gdo-dcp.ucllnl.org/)
The same analysis of CMIP5-LOCA-VIC projected streamflow, temperature, and precipitation
for the South Platte River at South Platte shows a similar pattern as for the Colorado
River, though with greater sensitivity to warming. For the South Platte, an ensemble-average
warming (~4°F) for 2050 relative to 1971-2000, coupled with no change in precipitation, is
associated with a streamflow decline of ~18%. If 1.5°F of that warming has already occurred,
that implies a warming-driven streamflow reduction of ~7% to date, with ~11% yet to come
by 2050 under the +4°F scenario. The magnitudes of these estimates are consistent with
previous studies that have examined climate change impacts for the South Platte
(Woodbury et al. 2012;
Harding 2015).
As noted earlier in section 2.2, most CMIP5 projections show increased interannual
variability in future precipitation for Colorado, implying that streamflow variability
would also increase. The projections for the Upper Colorado River Basin (Lees Ferry) as
analyzed for
Lukas et al. (2020),
also from the CMIP5-LOCA-VIC dataset, show increases in
the coefficient of variation (CV) of annual streamflows from the late 20th century
(1950-1999) to the mid-21st century (2025-2074) in about 70% of the projections.
Future changes in the annual volume of streamflow due to warming will also be accompanied
by changes in the timing of streamflow, consistent with the shifts in timing that have
already been observed in the past few decades. For streamflow timing, projections based
on climate models show near-unanimity regarding the direction of change towards even
earlier snowmelt, runoff, and peak streamflow.
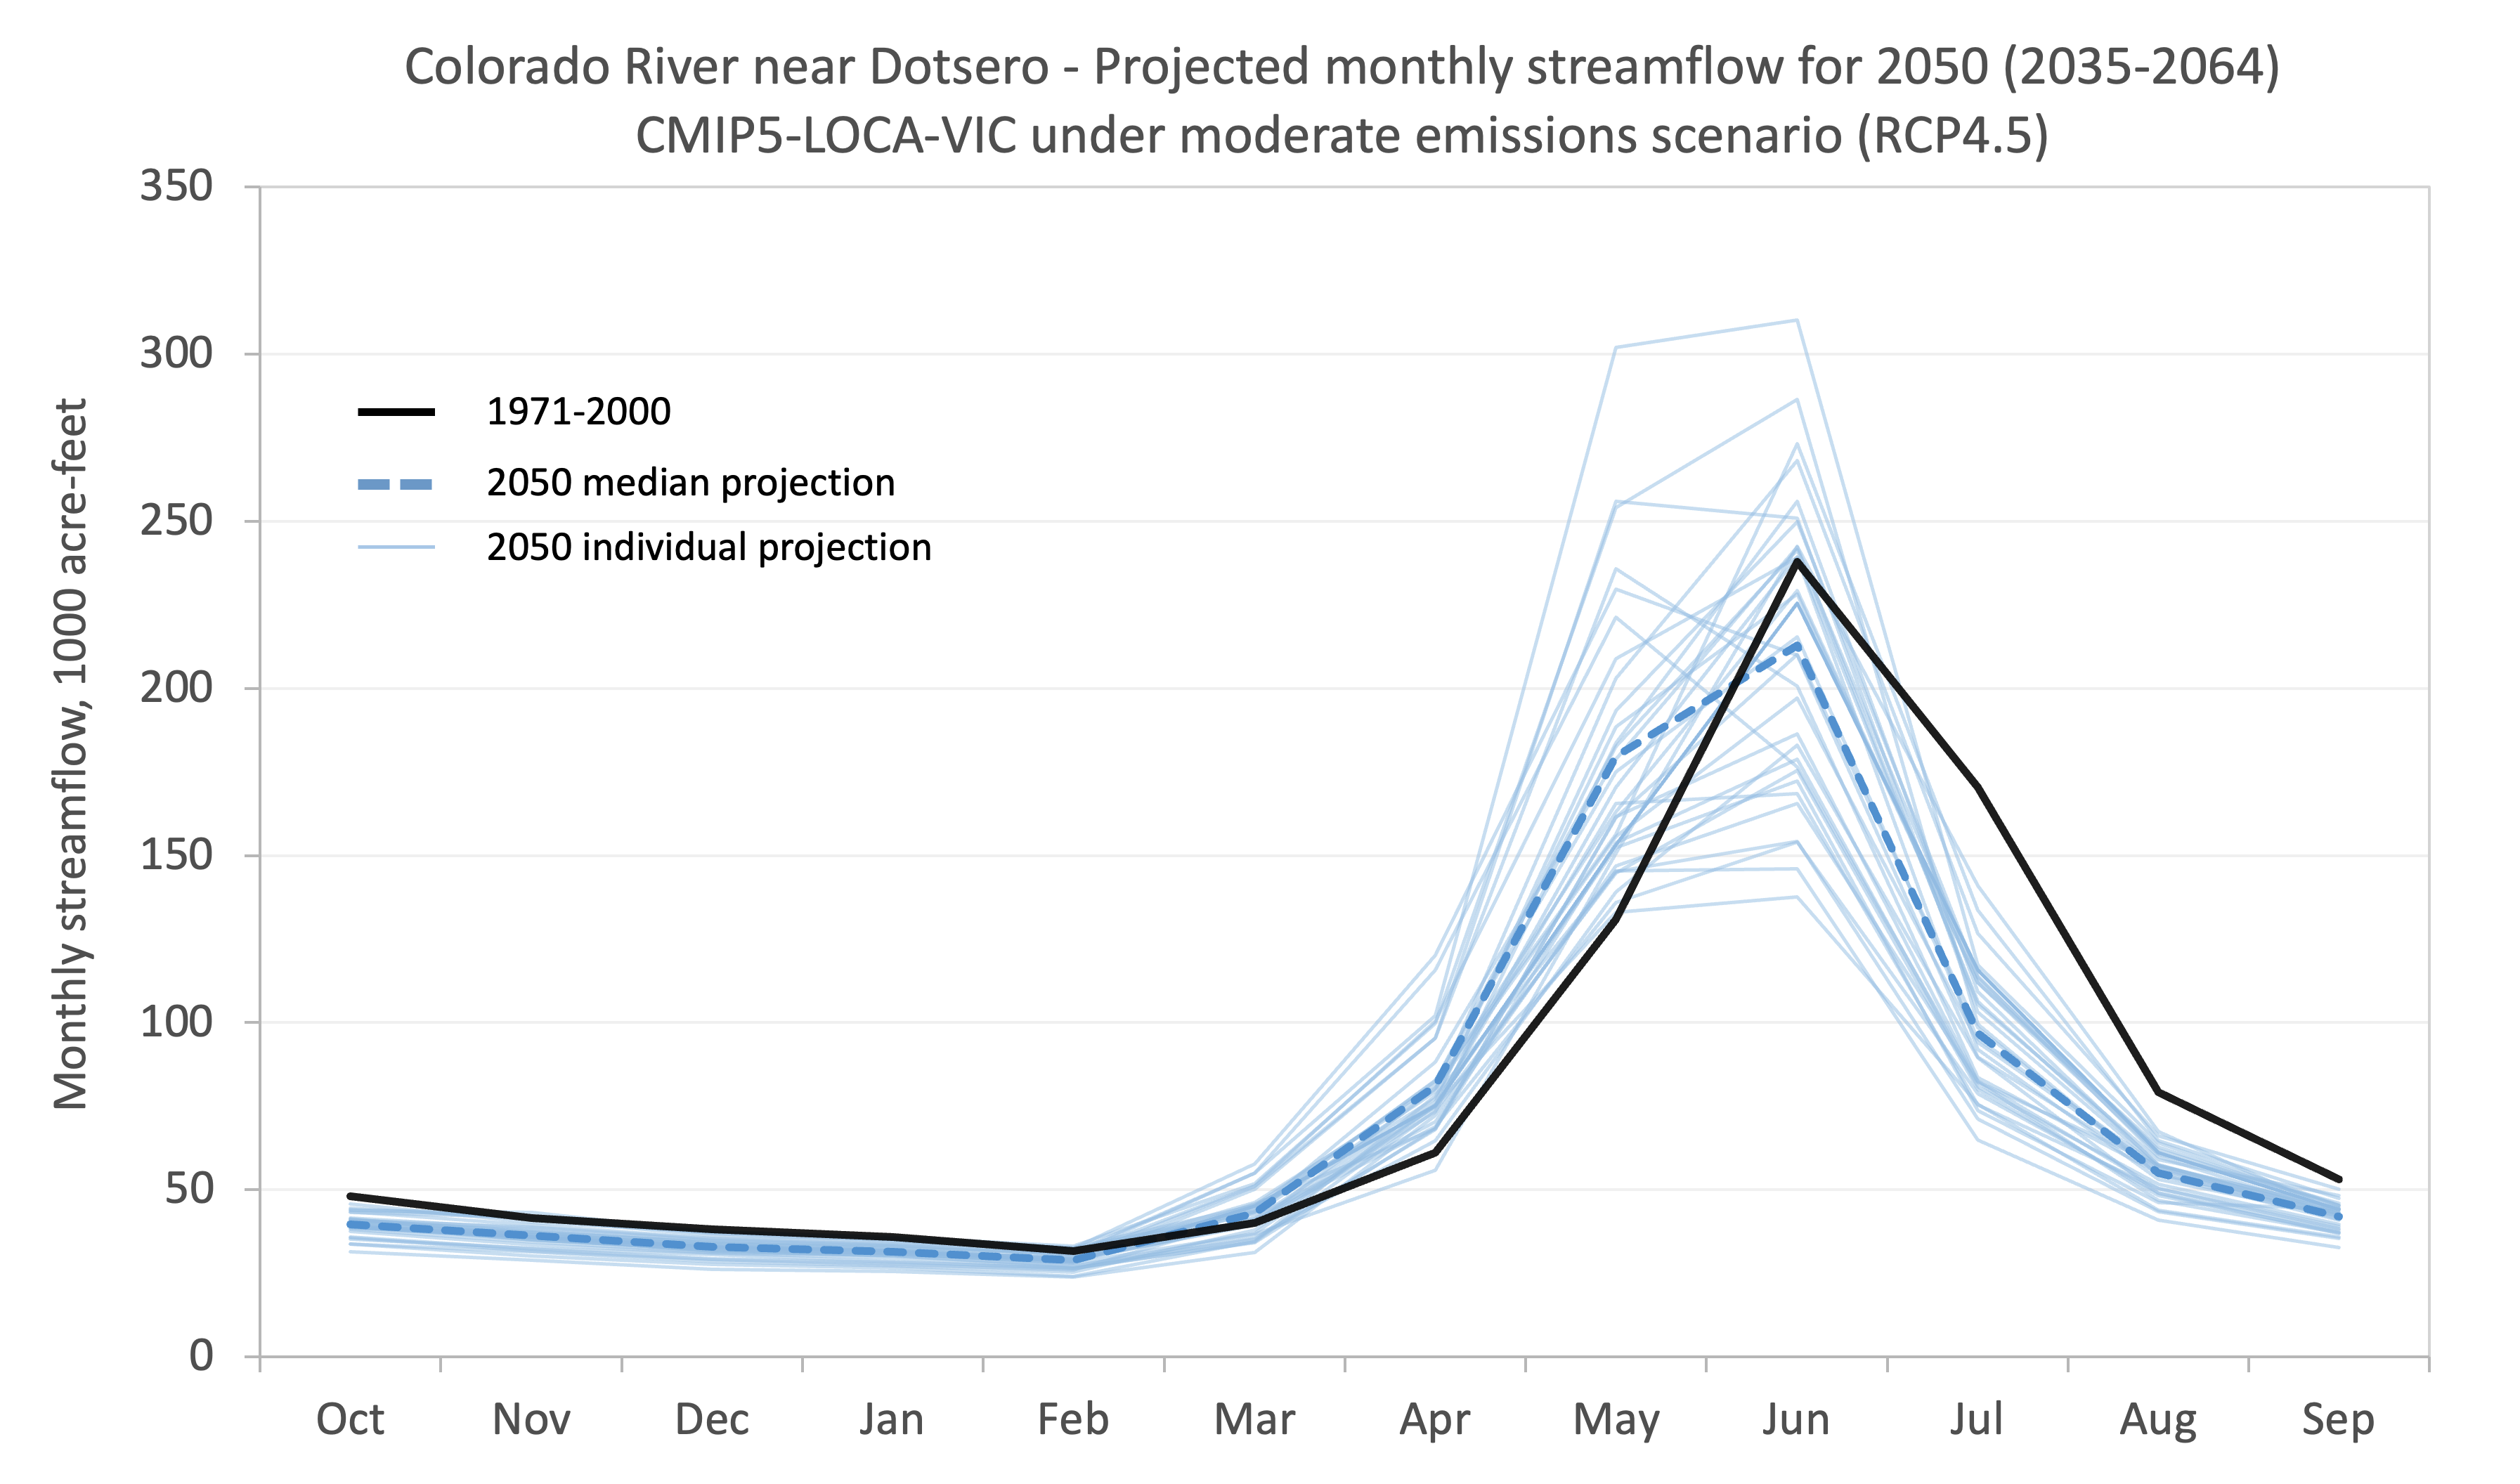
Figure 3.7 shows the CMIP5-LOCA-VIC projections of monthly streamflow for the Colorado
River near Dotsero for the 2050-centered period compared to the 1971-2000 baseline.
There are systematic shifts in the streamflow for almost all months. For March, April,
and May, monthly streamflow increases across the model projections as snowmelt and
runoff is initiated earlier, and the hydrograph shifts from a sharp peak in June to a
more of a “plateau” across May and June, with a May peak in some cases. Flows in June
decrease in most projections, and then as the declining limb of the hydrograph shifts and
steepens, flows in July, August, and September decrease sharply in all projections.
Late fall and winter baseflows (Oct-Feb) are also lower in nearly all projections.
Note that this modeled shift in the hydrograph does not consider the effects of
dust-on-snow deposition (Chapter 4), which also acts to shift snowmelt and runoff earlier
in the spring. Especially in the southwestern basins of Colorado, which have experienced
greater dust-on-snow impacts, a future increasing trend in dust-on-snow events and dust
deposition could have a larger effect on shifting the runoff timing than climate change
alone and would compound the warming-related shift
(Deems et al. 2013;
Painter et al. 2018).
Figure 3.7
Projected future monthly streamflows for the Colorado River at Dotsero for a 2050-centered
period (2035-2064) from an ensemble of 32 CMIP5-LOCA-VIC hydrology projections (thin
blue) under a medium-low emissions scenario (RCP4.5), and the simulated mean streamflow
for the 1971-2000 period (black). (Data: GDO-DCP, https://gdo-dcp.ucllnl.org/)
Soil moisture is an important component of Colorado’s hydrologic cycle. Balanced soil
water content is essential for the health of agricultural and natural ecosystems.
Persistent low soil moisture levels will reduce agricultural yields, stress native
vegetation, and reduce both the amount and predictability of Colorado’s water supply
(Livneh and Badger 2020;
Sazib et al. 2020;
Goble et al. 2021).
Extreme wet soil moisture
anomalies, which are much less common in Colorado, are associated with increased flooding
and pest and disease issues
(Javelle et al. 2010;
Chuang et al. 2012).
Soil moisture has an important feedback effect on weather. Part of the sun’s incoming
energy evaporates water from bare soil and leads plants to transpire water from their
leaves while carrying out photosynthesis. When soil moisture is unavailable, this
fraction of the sun’s energy instead will directly heat the Earth’s surface. Low soil
moisture also limits atmospheric water vapor near the ground, an important ingredient
for generating thunderstorms. Particularly during summer, dry soils will act to sustain
hot, dry atmospheric conditions until a large-scale weather system breaks the pattern
(McKinnon et al. 2021).
Much of Colorado is classified as a semi-arid climate, which means some soil moisture
limitations are to be expected in a normal year. Surface soil moisture gets recharged
only after rain events and then used by plants for transpiration. Plants with access to
only shallow soil moisture (less than 36”) must be able to survive for days-to-weeks
during the growing season without water. Trees and deep-rooted plants can make use of
deeper soil moisture supplied primarily from snowmelt.
In Colorado our understanding of soil moisture averages, seasonal variation, interannual
variation, and trends at large spatial scales comes mainly from modeling. Land surface
models (e.g., Noah, VIC), which use observed weather data as inputs, are often relied
upon to enhance our understanding of Colorado soil moisture. The combination of the
Snowpack Telemetry Network (SNOTEL) and Colorado Agricultural Meteorological Network
(CoAgMET) offer a limited (< 20 years) observational record at high (8000+ feet) and
low elevations. Additionally, it is difficult to interpolate between observations because
soil moisture is dependent on soil type, which can change over short distances.
Root-zone soil moisture in Colorado typically peaks in the spring both at high and low
elevations. High-elevation soil moisture increases sharply as the snowpack melts. Lower
elevation soil moisture, particularly on the eastern plains, remains low through the
dry season in winter but increases in response to cool, soaking rains in the spring.
During the summer season, soil moisture decreases overall due to evapotranspiration but
spikes in response to convective rain events. Soil moisture is typically lowest at the
end of the growing season (early fall).
Observed Soil Moisture Changes
Soil moisture models typically do a poor job detecting long-term trends in soil moisture.
Fan et al. (2004)
showed that on a global scale, soil moisture models capture the
seasonal cycle and spatial variability of soil moisture better than trends. Even so,
Andreadis and Lettenmaier (2006)
found significant decreases in soil moisture in
southern Colorado from the mid-20th century to the early 21st century.
Tobin et al. (2020)
showed significant decreases in soil moisture for eastern Colorado in summer and fall.
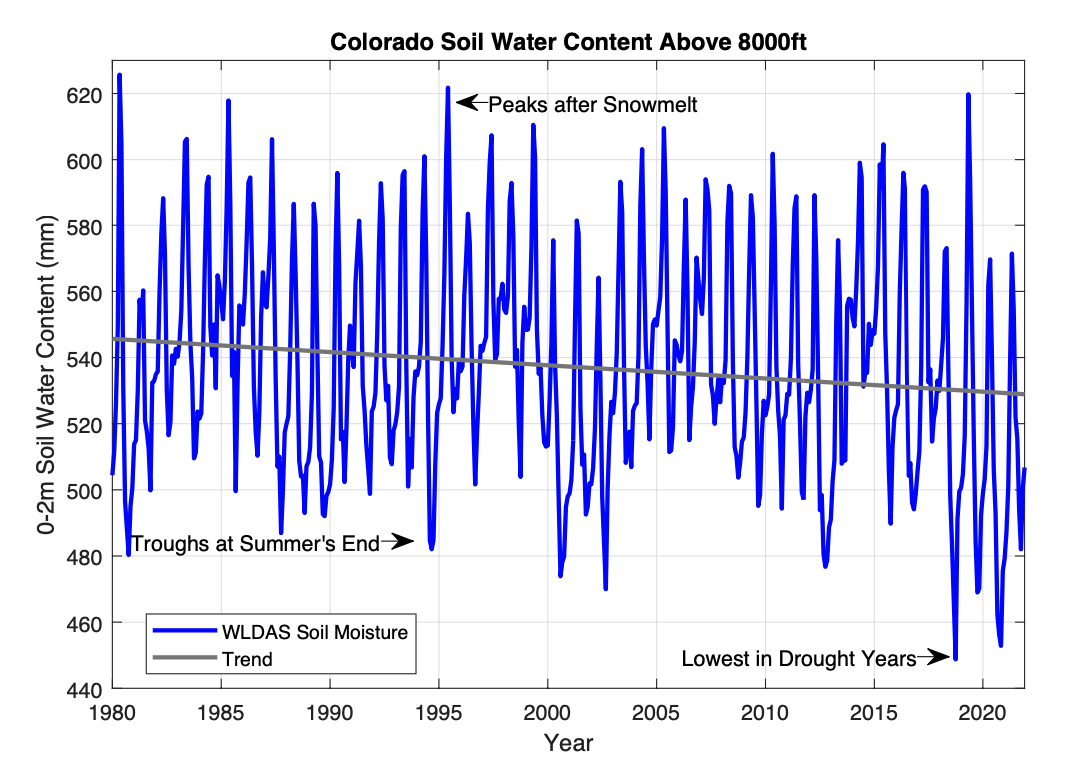
Like precipitation, snowpack, and streamflow, soil moisture varies considerably from year
to year based on weather patterns. Based on the Western Land Data Assimilation
System (WLDAS) model analyses for elevations above 8000’ in Colorado, soil moisture
in the uppermost 2 m (80”) has declined from 1980-2022 (Figure 3.8). Water year 2021 saw
near record-low fall soil moisture conditions following a poor snowpack year and a hot and
dry summer, including a record-warm August for western Colorado
(NOAA National Centers
for Environmental Information 2023).
Figure 3.8
Colorado volumetric water content in top 2m soils above 8000ft, for 1980-2022. WLDAS
model reanalysis soil moisture in blue, with trend line in gray.
As the climate continues to warm, the evaporative demand of the atmosphere increases
(see section 3.5), which will tend to drive more moisture from soils through both
direct evaporation and transpiration from plants, i.e., evapotranspiration. In
high-elevation areas where most soil moisture derives from snowmelt, warming temperatures
will act to reduce the snowpack through sublimation even before that snow water has a
chance to enter the soils.
Previous studies projecting future (~mid-21st century) soil moisture for Colorado’s key
runoff-producing basins have consistently shown widespread declines in summer (June-August)
soil moisture (typically, down to 2 m/80”) regardless of the ensemble of climate models and
hydrologic models used
(Ray et al. 2008;
Reclamation 2012a;
Ayers et al. 2016). These
analyses also showed increases in spring (March-May) soil moisture as snowmelt shifts
earlier (see section 3.4) and leads to a saturated soil column earlier in the year
relative to historical conditions.
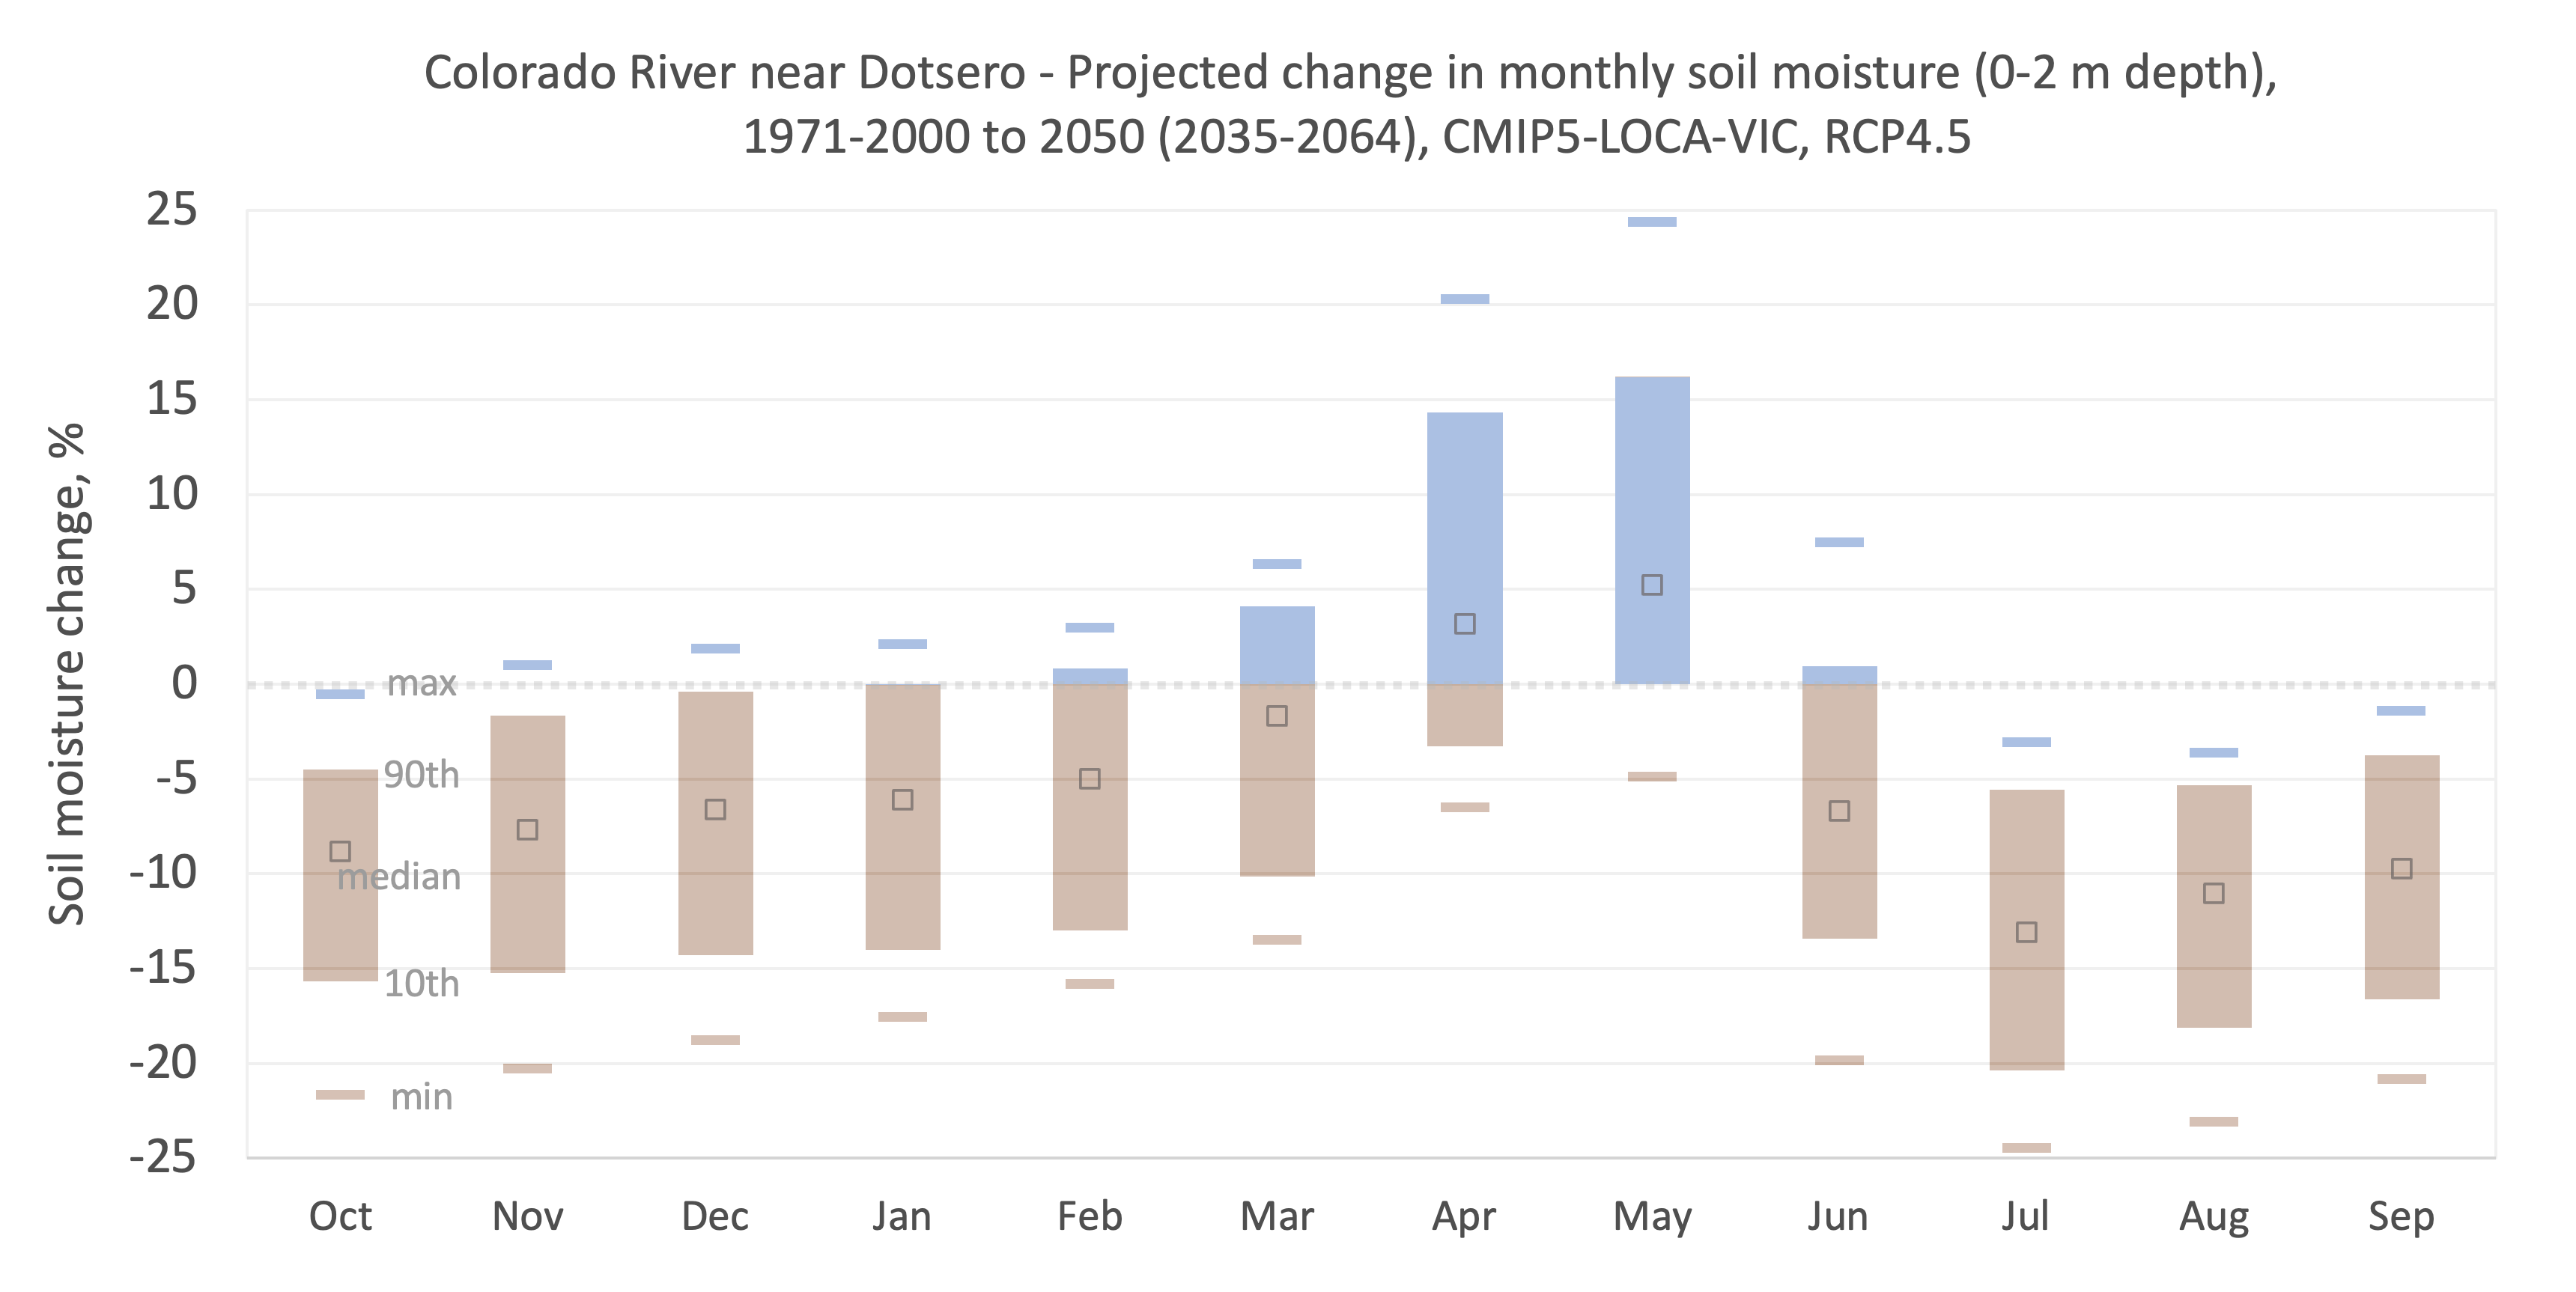
Figure 3.9
Projected future changes in monthly soil moisture (0-2 m depth) for the watershed above
the Colorado River near Dotsero for a 2050-centered period (2035-2064) from an ensemble of
32 CMIP5-LOCA-VIC hydrology projections under a medium-low emissions scenario (RCP4.5).
The solid blue and brown bars show the middle 80% of the model projections (10th-90th
percentiles); the two dashes show the minimum and maximum projections; the open squares
show the median projections. (Data: GDO-DCP, https://gdo-dcp.ucllnl.org/)
Figure 3.9 shows the CMIP5-LOCA-VIC projections of change in monthly total soil moisture
(0-2 m/0-79” depth) for the watershed above the Colorado River near Dotsero for the
2050-centered period, compared to the 1971-2000 baseline. The pattern in monthly and
seasonal changes is consistent with the previous studies. Most of the individual
projections show increases in spring (April-May) soil moisture, due to earlier snowmelt,
but nearly all projections show decreases in the summer, fall, and winter months, driven
by warming temperatures. Since soil moisture—along with the snowpack—acts as the
interface between the atmosphere and streamflow, it is not surprising that these projected
changes in soil moisture appear very similar to the projections of change in monthly
streamflow (Fig 3.7 above).
3.5 Evapotranspiration
Overview
Evapotranspiration (ET) encompasses evaporation from soils and open water, transpiration
from plants and crops, and sublimation from the snowpack. On a statewide basis, about 80%
of the precipitation that falls on Colorado returns to the atmosphere through ET before
reaching a stream or aquifer. The relatively cool and wet high mountain areas experience
smaller fractional ET losses, but typically amount to 30-50% of annual precipitation
(Sanford and Selnick 2013).
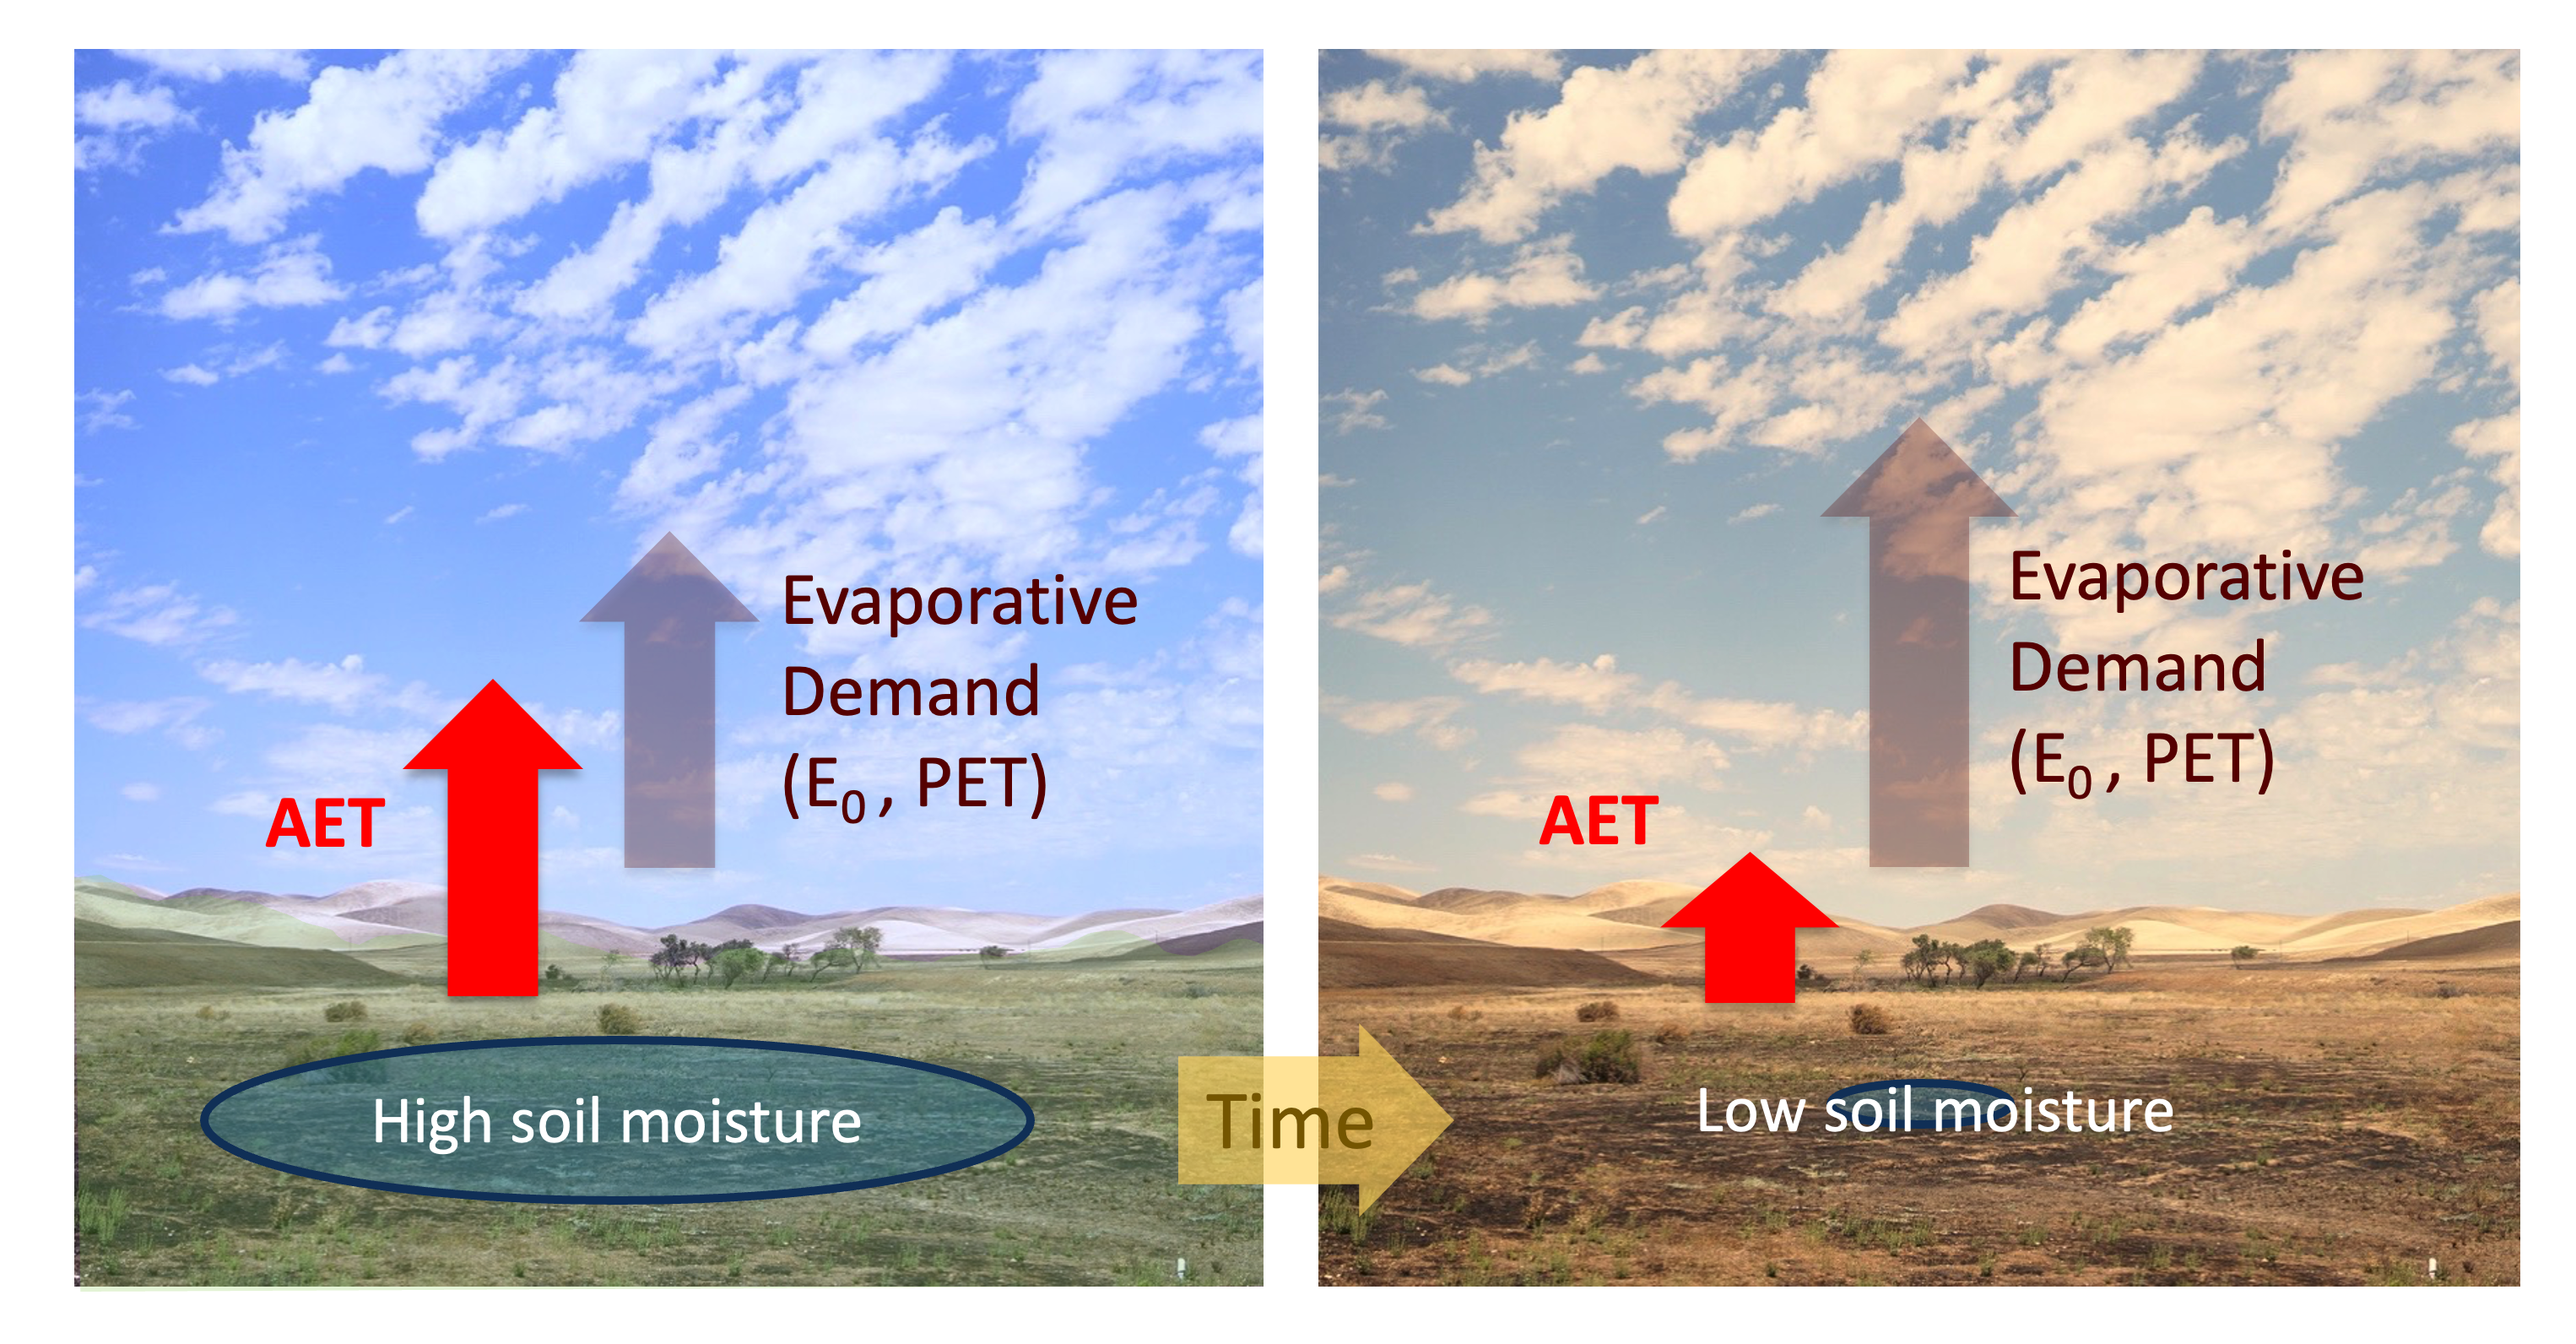
ET technically refers to the actual loss of water from the land surface — thus, the
alternative abbreviation AET (actual evapotranspiration) is used for clarity. The
magnitude or rate of AET is constrained by the water that is available to evaporate or
transpire (Figure 3.10). After soils and vegetation are fully dried out, no more AET
can occur. So cumulative AET over an extended period (e.g., 12 months) will not exceed
cumulative precipitation - or in the case of irrigated cropland, precipitation plus the
depth of irrigation water.
Evaporative demand (E0) and its equivalent, Potential Evapotranspiration (PET), are
measures of the atmosphere’s “thirst” for surface moisture, and thus the potential loss
of water from the land’s surface. E0 and PET can exceed and often do exceed AET over
any given period. The conceptually similar Reference ET (ET0) is an estimate of the
upper bound of ET losses given a particular crop that is fully irrigated. Reference ET
is the measure of evaporative demand that is usually reported by agricultural weather
station networks such as CoAgMET.
Evaporative demand increases with warmer temperatures, greater solar radiation, lower
humidity, and higher winds. Of these, temperature is usually the most important in
explaining the level of evaporative demand. PET, E0, and Reference ET are best estimated
using a “fully physical” equation such as Penman-Monteith that inputs all four variables:
temperature, solar radiation, humidity, and winds; methods using only temperature
(Thornwaite, Hargreaves, Blaney-Criddle) have larger errors in real-time monitoring
(Sentelhas et al. 2010) and are also problematic for modeling future conditions
(Reclamation 2012b).
The tight coupling between temperature and evaporative demand reflects a basic physical
relationship, as well as an important feedback mechanism. First, warmer air can hold
more moisture than cooler air, as governed by the Clausius-Clapeyron equation. This means
that under warmer temperatures — if nothing else changes — evaporative demand increases.
This general increase in evaporative demand (PET) with higher temperatures is clearly
seen in the seasonal cycle shown in Figure 3.12. Second, when the soils and vegetation
dry out seasonally or periodically (i.e., drought) — which often involves increased
evaporative demand — a feedback mechanism occurs: More of the sun’s energy heats the
surface and the atmosphere above it, rather than going towards evaporating moisture.
This drives faster warming, and lower humidity of the air, thus increasing evaporative
demand more rapidly (Figure 3.10, right panel).
Figure 3.10
Schematic showing how under high soil moisture and water availability, Actual
Evapotranspiration (AET) can have the same magnitude as evaporative demand. With time,
if the soils dry out, evaporative demand will often increase (as air temperature rises
and humidity decreases in response to the now-dry land surface) but AET decreases,
limited by the lower amount of water available at the surface to evaporate and transpire.
(Modified from Lukas et al. 2017, The EDDI User Guide).
AET is much more challenging to measure than evaporative demand. AET can be estimated
using a land-surface (hydrology) model with meteorological inputs, or by assimilating
satellite observations of land-surface temperature (which reflects evaporation losses)
into an energy-balance model. In-situ measurements of AET can be made using Eddy
Covariance (EC) methods, in which several instruments at different heights on a tower
measure the vertical transfer of energy and moisture between the surface and the
atmosphere.
Observed Evapotranspiration Changes
Since rising temperatures, all else equal, will lead to higher evaporative demand
(E0, PET, Reference ET), it is reasonable to expect that trends in evaporative demand
would reflect the strong warming trend in Colorado over the last several decades. And in
fact, upward trends in evaporative demand for Colorado have been found in several
studies, using different observational datasets
(Ficklin et al. 2015;
McCabe and Wolock 2015;
Vicente‐Serrano et al. 2020;
Albano et al. 2022).
Most recently, a comparison of recent U.S. trends in Reference ET (1980-2020), using
five gridded observational datasets, found that the average of the datasets show
increasing Reference ET trends across all of Colorado, with the largest increases seen
in southeastern Colorado, moderate increases in the northeastern and far southwestern
parts of the state, and the smallest increases in the northwest part of the state
(Albano et al. 2022).
Examination of the four meteorological components of evaporative
demand shows that decreased humidity and increases in solar radiation only contributed a
small amount to the observed increase in evaporative demand.
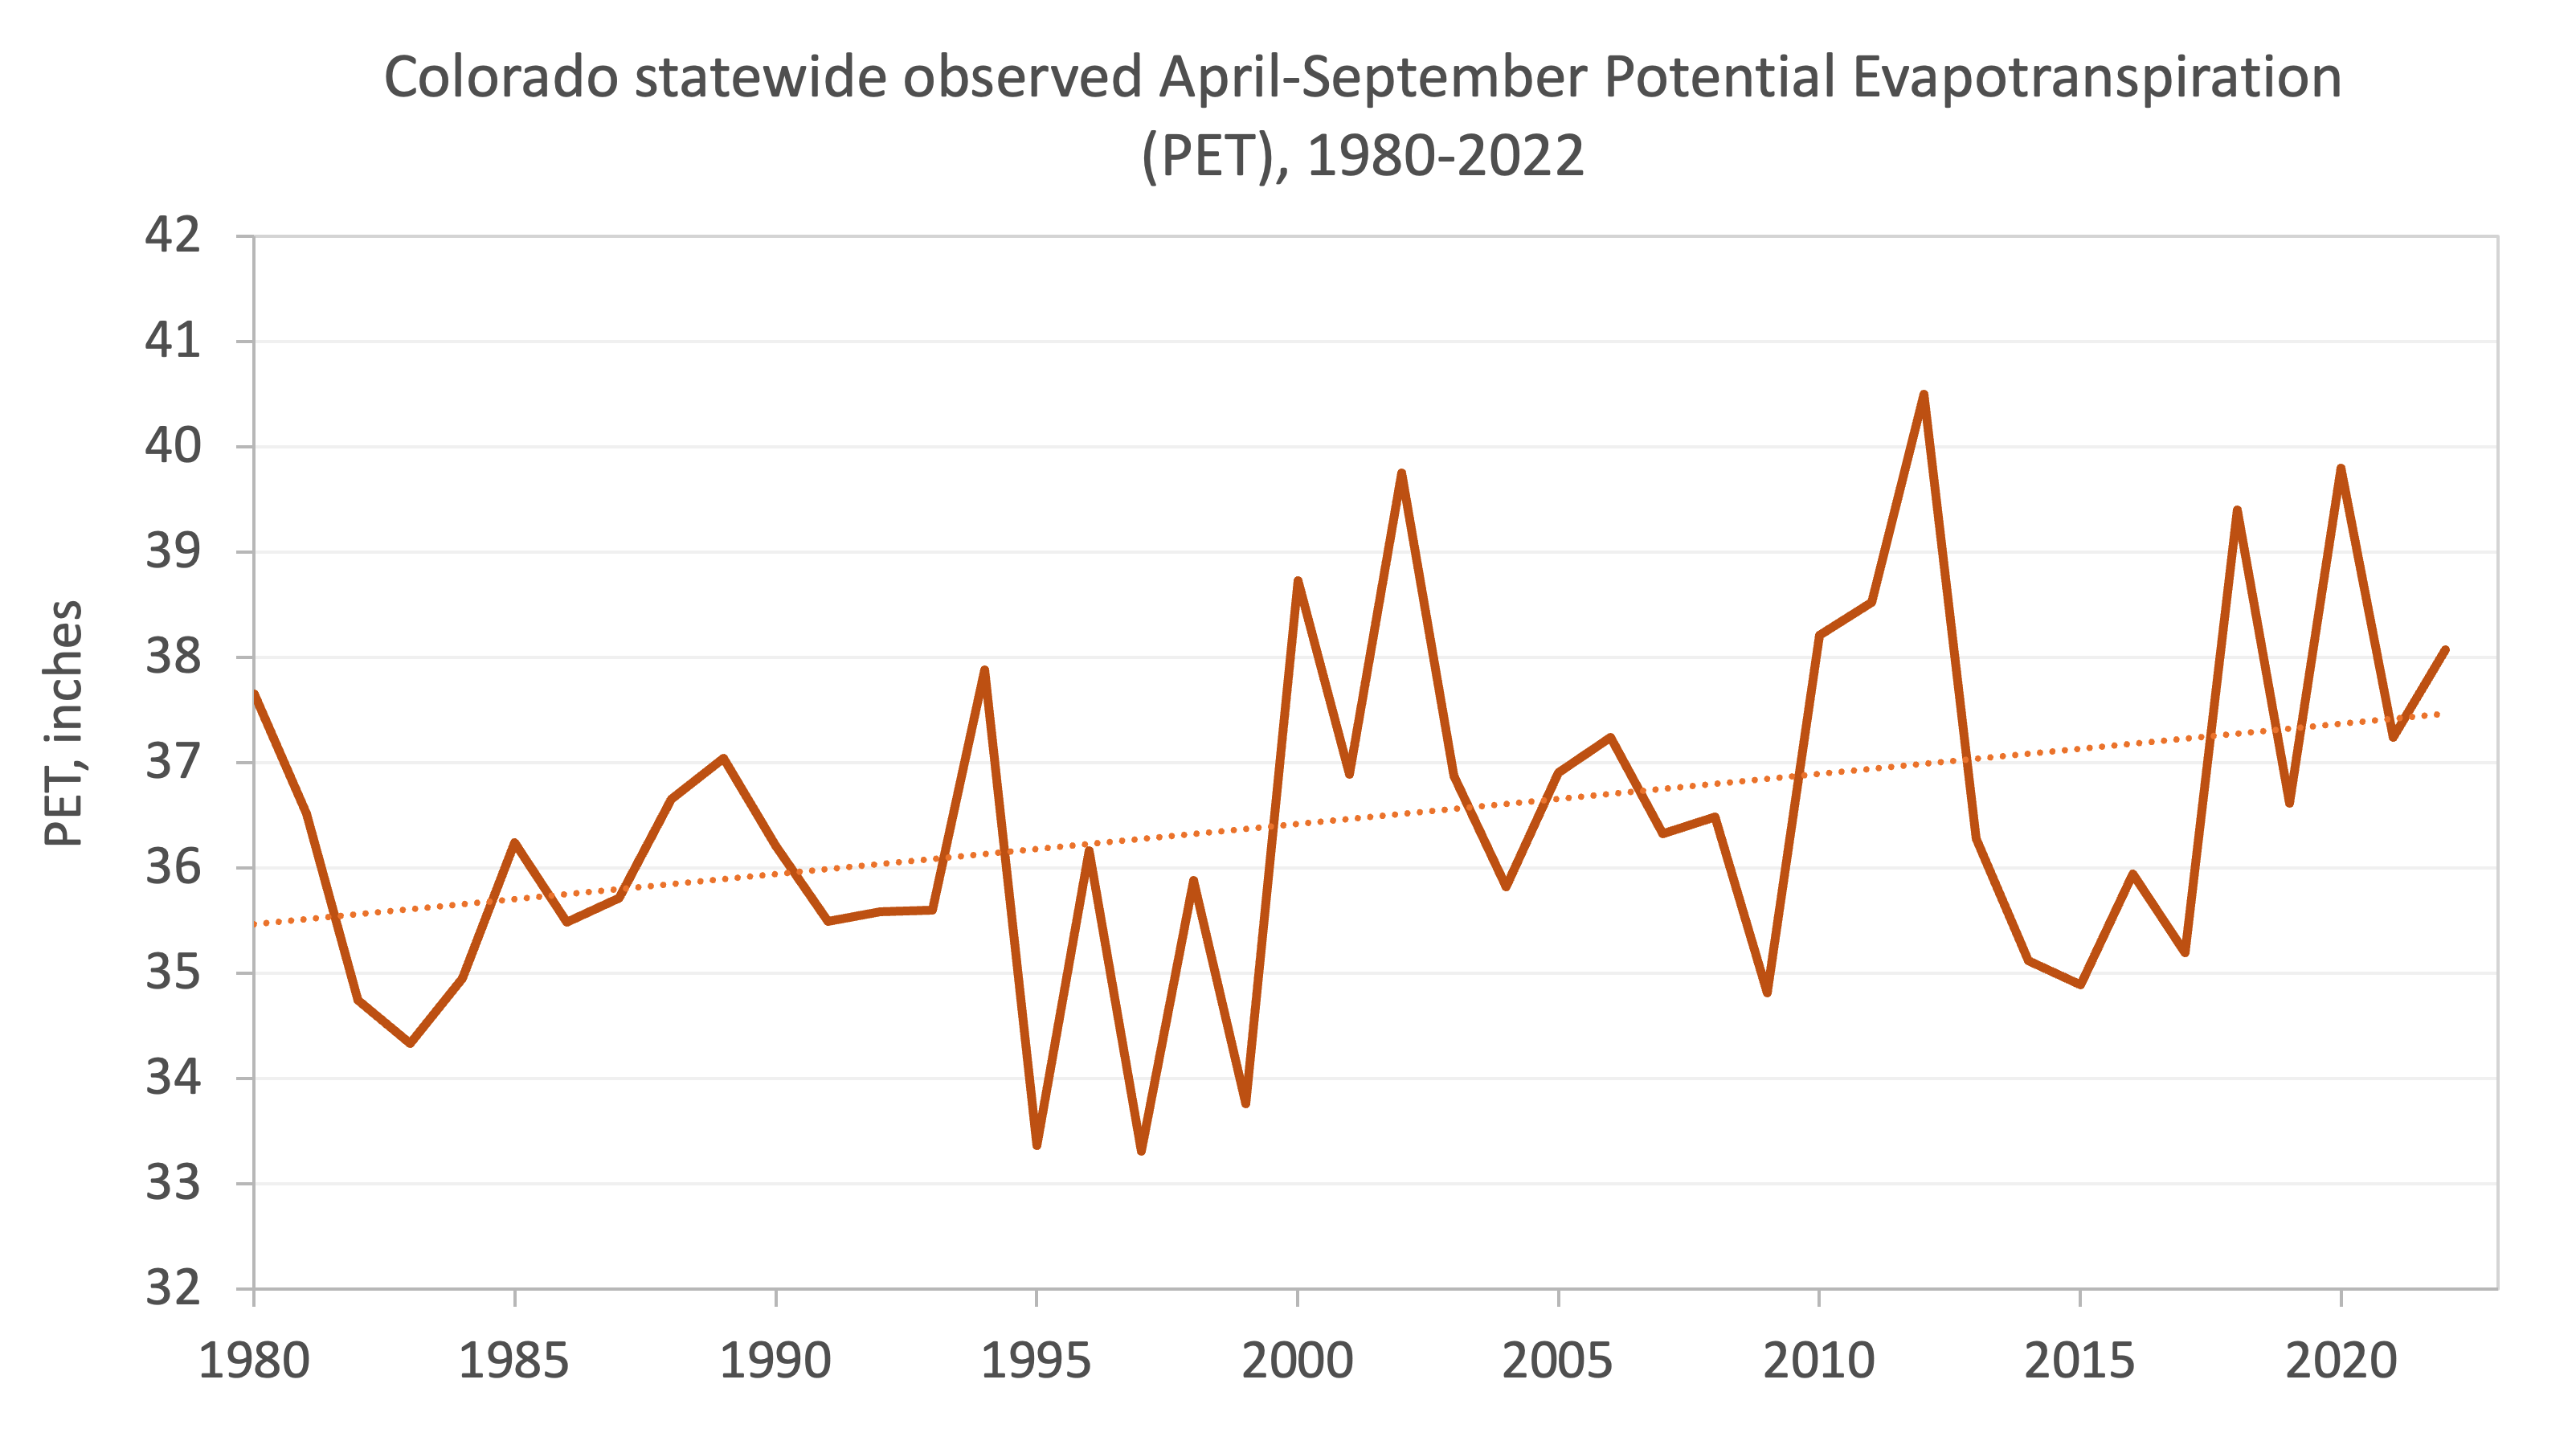
Figure 3.11 shows Colorado statewide PET for the growing season (April-September) since
1980, from the gridMET gridded observational dataset, one of the five used in the
Albano et al. (2022)
study, and whose results are closest to the average across all five
datasets. While there is large variability from year to year, the upward trend is clear;
statewide PET has increased about 5% over the 1980-2022 period.
Figure 3.11
Observed Colorado statewide Potential Evapotranspiration (PET) over the April-September
growing season, 1980-2022. Dashed line shows the linear trend over that period.
(Data: gridMET via Climate Toolbox; https://climatetoolbox.org/tool/ historical-climate-tracker).
Given the continued and substantial warming projected for Colorado over the next several
decades, further increases in evaporative demand in Colorado are extremely likely.
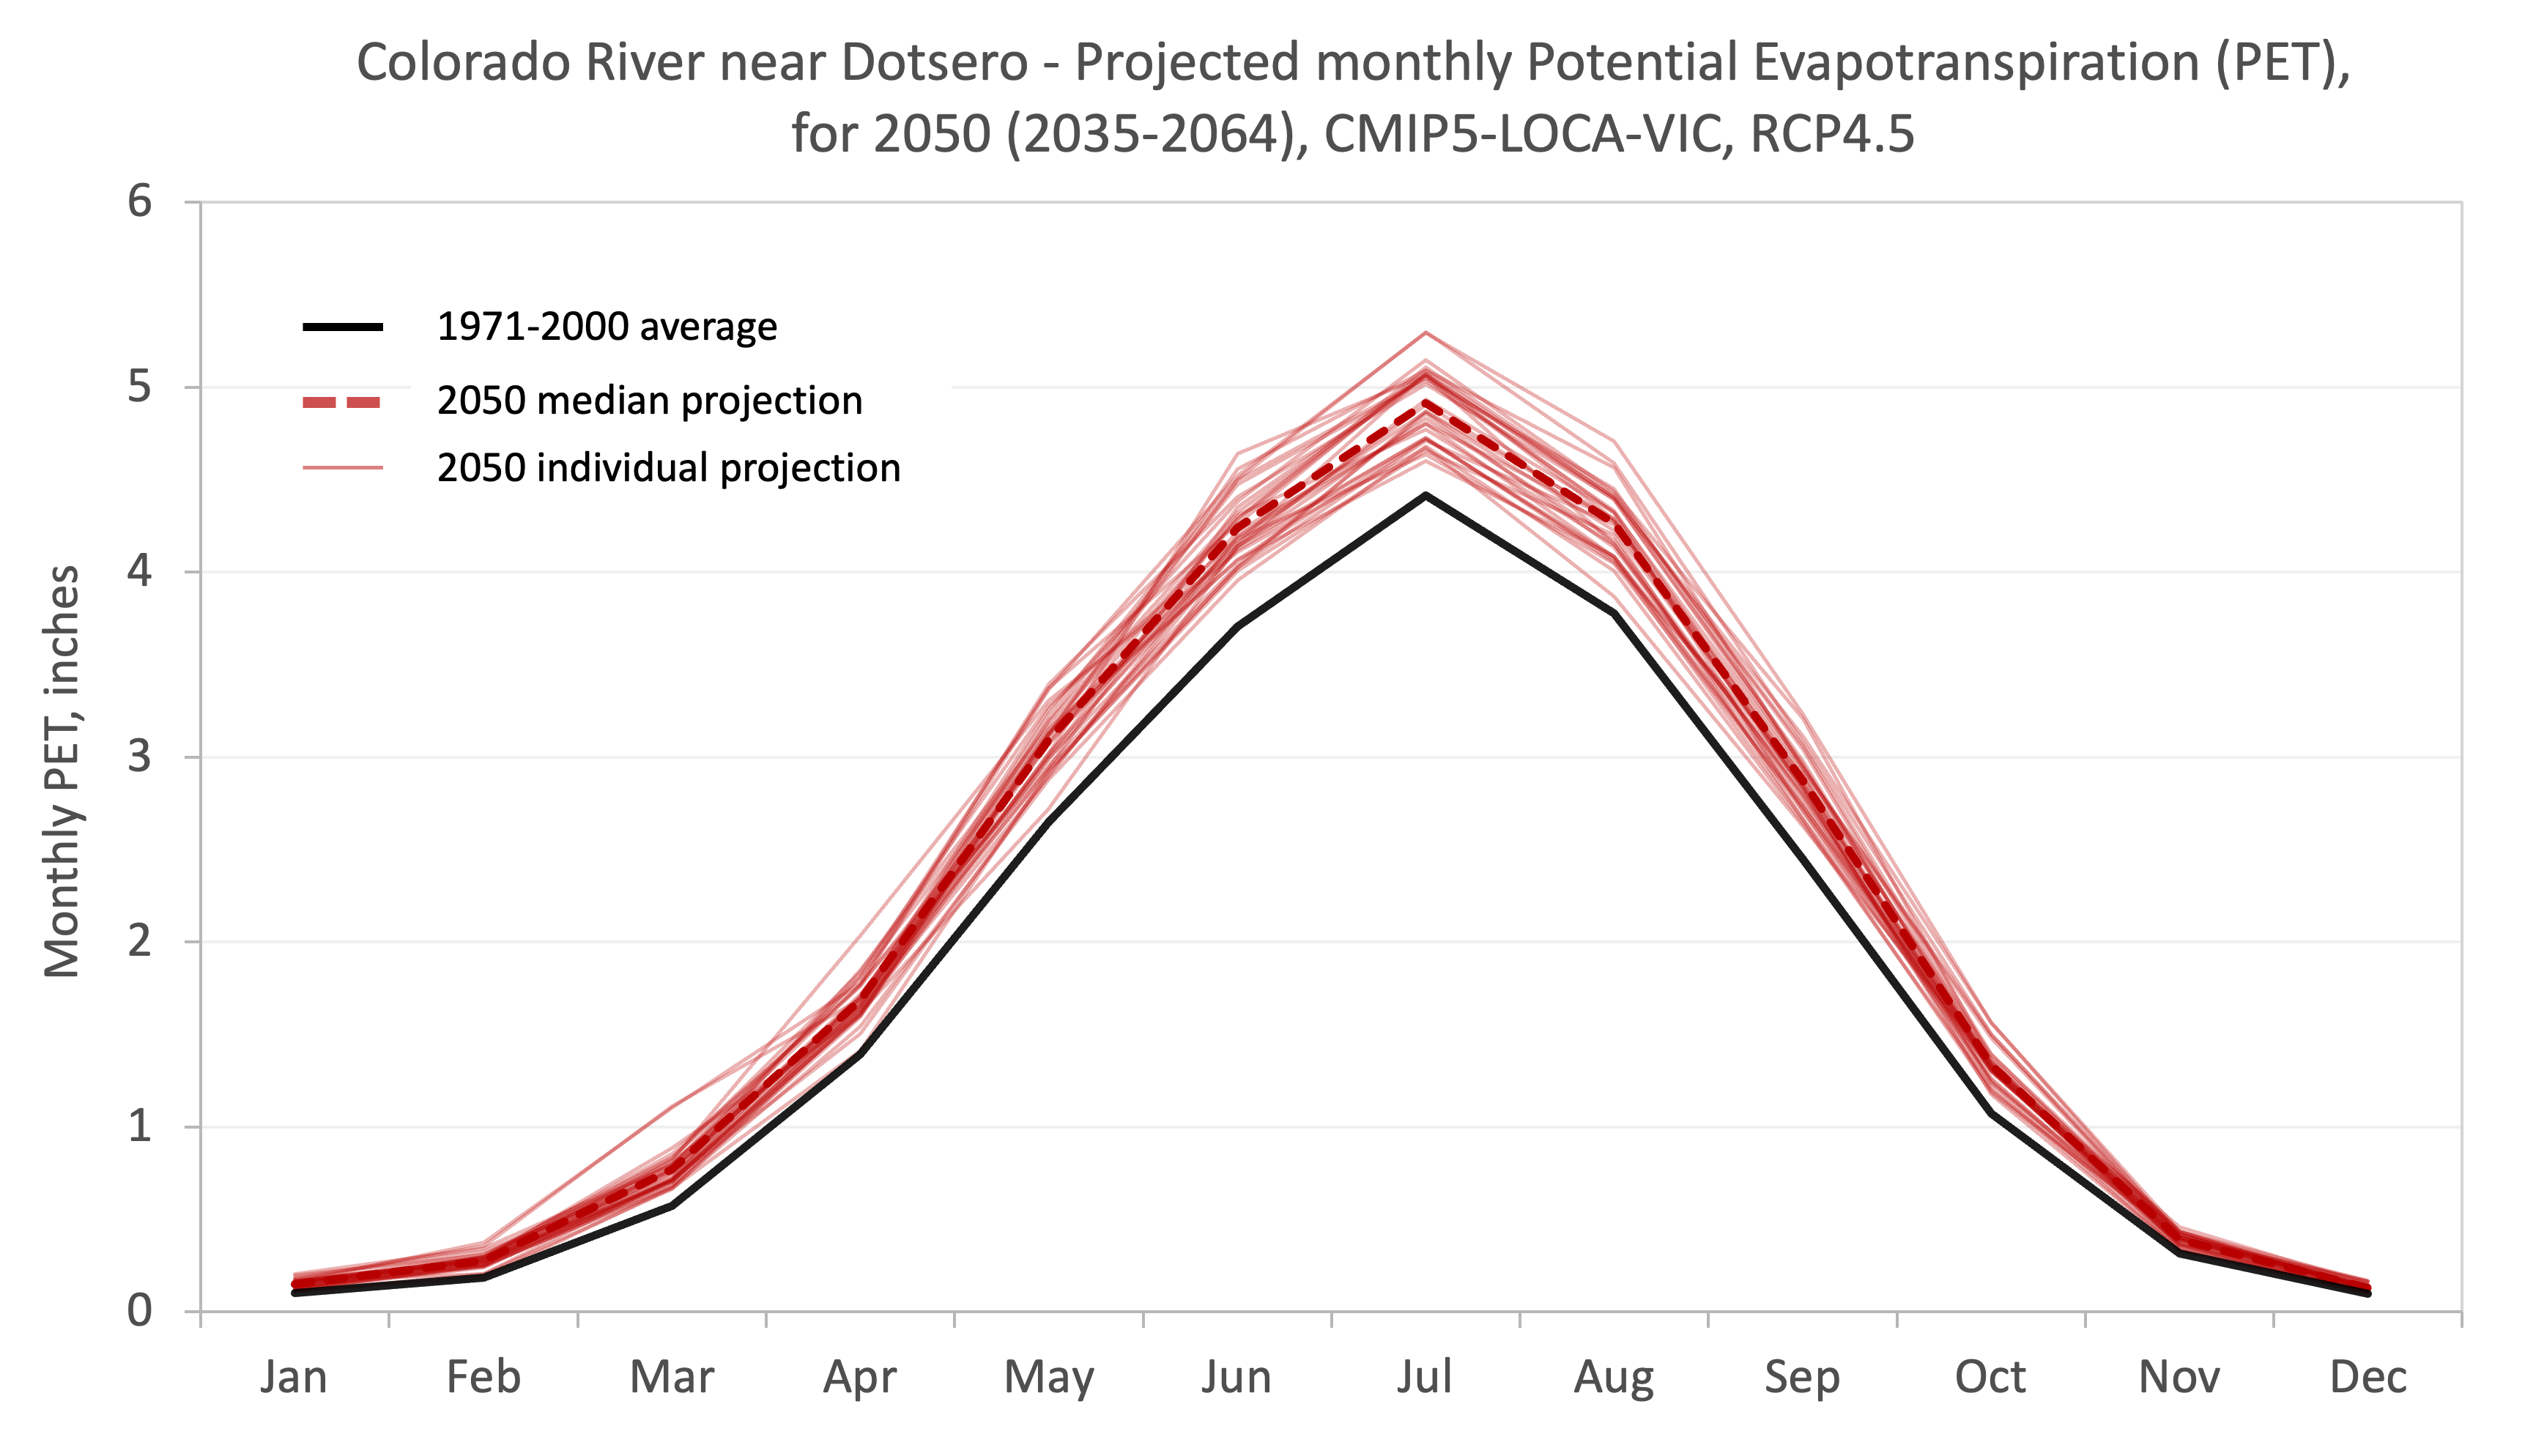
Figure 3.12 shows the projected changes monthly PET under RCP4.5 between the historical
baseline (1971-2000) and the 2050-centered period (2035-2064) for the watershed of the
Colorado River above Dotsero, using the same projection dataset (CMIP5-LOCA-VIC) in the
preceding sections.
Figure 3.12
Projected future monthly Potential Evapotranspiration (PET) for the watershed above the
Colorado River at Dotsero for a 2050-centered period (2035-2064) from an ensemble of
32 CMIP5-LOCA-VIC hydrology projections (thin red) and median (thick red dashed) under
a medium-low emissions scenario (RCP4.5), and the simulated mean streamflow for the
1971-2000 period (black). (Data: GDO-DCP, https://gdo-dcp.ucllnl.org/)
Note the extreme seasonality in PET; about 90% of annual PET occurs from April through
September. In each month of the year, all 32 projections show increased PET; total
April-September PET increases 10% to 20% by 2050 compared to the 1971-2000 baseline.
Comparing the PET change with the temperature change in the same 32 model runs, it is
clear that temperature is the primary driver of increased PET. Each 1°F of warming leads
to about a 4% increase in PET, with a 4°F warming associated with a 15% increase in
PET. A similar downscaled projection dataset (CMIP5-MACA), also paired with the VIC
hydrologic model, suggests that increases in PET of roughly similar magnitude (~4%) for
each 1°F of warming
will occur across all elevations both east and west of the Continental Divide.
Alizadeh, M. R., J. T. Abatzoglou, C. H. Luce, J. F. Adamowski, A. Farid, and M. Sadegh,
2021: Warming enabled upslope advance in western US forest fires.
Proc. Natl. Acad.
Sci. U.S.A., 118, e2009717118, https://doi.org/10.1073/pnas.2009717118.
American Meteorological Society, 2022: Downslope windstorm.
Glossary of Meteorology,
available online at: https://glossary.ametsoc.org/wiki/Downslope_windstorm.
Boustead, B. E. M., S. D. Hilberg, M. D. Shulski, and K. G. Hubbard, 2015: The
Accumulated Winter Season Severity Index (AWSSI). Journal of Applied Meteorology and
Climatology, 54, 1693–1712, https:// doi.org/10.1175/JAMC-D-14-0217.1.
Domeisen, D. I. V., and Coauthors, 2023: Prediction and projection of heatwaves.
Nature Reviews Earth & Environment, 4, 36–50, https://doi.org/10.1038/s43017-022-00371-z.
Gochis, D., and Coauthors, 2015: The Great Colorado Flood of September 2013.
Bulletin of the American Meteorological Society, 96, 1461–1487,
https://doi.org/10.1175/BAMS-D-13-00241.1.
Hirsch, R. M., and K. R. Ryberg, 2012: Has the magnitude of floods across the USA changed with global CO 2 levels? Hydrological Sciences Journal, 57, 1–9, https://doi.org/10.1080/02626667.2011.62 1895.
Hoerling, M., J. Eischeid, J. Perlwitz, X.-W. Quan, K. Wolter, and L. Cheng, 2016: Characterizing Recent Trends in U.S. Heavy Precipitation. Journal of Climate, 29, 2313–2332, https://doi.org/10.1175/ JCLI-D-15-0441.1.
Hoerling, M. P., J. Eischeid, and J. Perlwitz, 2010: Regional precipitation trends: distinguishing natural vari- ability from anthropogenic forcing. Journal of Climate, 23, 2131–2145, https://doi.org/10.1175/ 2009JCLI3420.1.
Hoerling, M. P., J. J. Barsugli, B. Livneh, J. Eischeid, X. Quan, and A. Badger, 2019: Causes for the Century-Long Decline in Colorado River Flow. J. Climate, JCLI-D-19-0207.1, https://doi.org/10.1175/JCLI-D-19-0207.1.
Holden, Z. A., and Coauthors, 2018: Decreasing fire season precipitation increased recent western US for- est wildfire activity. Proc. Natl. Acad. Sci. U.S.A., 115, https://doi.org/10.1073/pnas.1802316115.
Kampf, S. K., D. McGrath, M. G. Sears, S. R. Fassnacht, L. Kiewiet, and J. C.
Hammond, 2022: Increasing wildfire impacts on snowpack in the western U.S.
Proc. Natl. Acad. Sci. U.S.A., 119, e2200333119, https://doi.org/10.1073/pnas.2200333119.
Mankin, J. S., I. R. Simpson, A. hoell, R. Fu, J. Lisonbee, A. Sheffield, and
D. Barrie, 2021: NOAA Drought Task Force Report on the 2020–2021 Southwestern U.S.
Drought. NOAA Drought Task Force, MAPP, NIDIS,
https://www.drought.gov/sites/default/files/2021-09/NOAA-Drought-Task-Force-IV-Southwest-Drought-Report-9-23-21.pdf.
Moritz, M. A., M. A. Parisien, E. Batllori, M. A. Krawchuk, J. Van Dorn, D. J.
Ganz, and K. Hayhoe, 2012: Climate change and disruptions to global
fire activity. Ecosphere, 3, art49, https://doi.org/10.1890/ES11-00345.1.
Mote, P. W., S. Li, D. P. Lettenmaier, M. Xiao, and R. Engel, 2018: Dramatic
declines in snowpack in the western US. npj Climate and Atmospheric Science,
1, https://doi.org/10.1038/s41612-018-0012-1.
NOAA National Centers for Environmental Information, 2023: NOAA Climate
at a Glance. https://www.ncei.noaa.gov/access/monitoring/climate-at-a-glance/statewide/time-series
(Accessed September 7, 2023).
Perkins, S. E., and L. V. Alexander, 2013: On the Measurement of Heat
Waves. Journal of Climate, 26, 4500–4517, https://doi.org/10.1175/JCLI-D-12-00383.1.
Raupach, T. H., and Coauthors, 2021: The effects of climate change on
hailstorms. Nature Reviews Earth & Environment, 2, 213–226,
https://doi.org/10.1038/s43017-020-00133-9.
Reclamation, 2012b: Colorado River Basin water supply and demand
study-Technical Report C. US Bureau of Reclamation,
https://www.usbr.gov/lc/region/programs/crbstudy/finalreport/Technical%20Report%20C%20-%20Water%20Demand%20Assessment/TR-C-Water_Demand_Assessmemt_FINAL.pdf
(Accessed April 26, 2019).
Schumacher, R.S., R.A. Bolinger, and J.J. Lukas, 2024: Development of alternate
climate divisions for Colorado based on gridded data. Submitted to Journal of
Applied and Service Climatology, May 2023.
Schwalm, C. R., S. Glendon, and P. B. Duffy, 2020: RCP8.5 tracks cumulative
CO2 emissions. Proc. Natl. Acad. Sci. U.S.A., 117, 19656–19657,
https://doi.org/10.1073/pnas.2007117117.
Trenberth, K. E., J. T. Fasullo, and T. G. Shepherd, 2015: Attribution of
climate extreme events. Nature Clim Change, 5, 725–730, https://doi.org/10.1038/nclimate2657.